
Makelaardij Schierbeek is een klein makelaarskantoor dat zich op persoonlijke begeleiding en maatwerk specialiseert. Door onze kleine omvang zijn we altijd bereikbaar en weten we wat er gebeurt. Wij werken actief in Assen en de omgeving, met een werkgebied dat zich uitstrekt over Noord- en Midden Drenthe, met Assen als kern. Bovendien zijn we ook aanwezig op de zuidkant van Groningen. Sander Jochems heeft sinds 1995 ervaring opgebouwd i...
Current housing stock
-

- Available
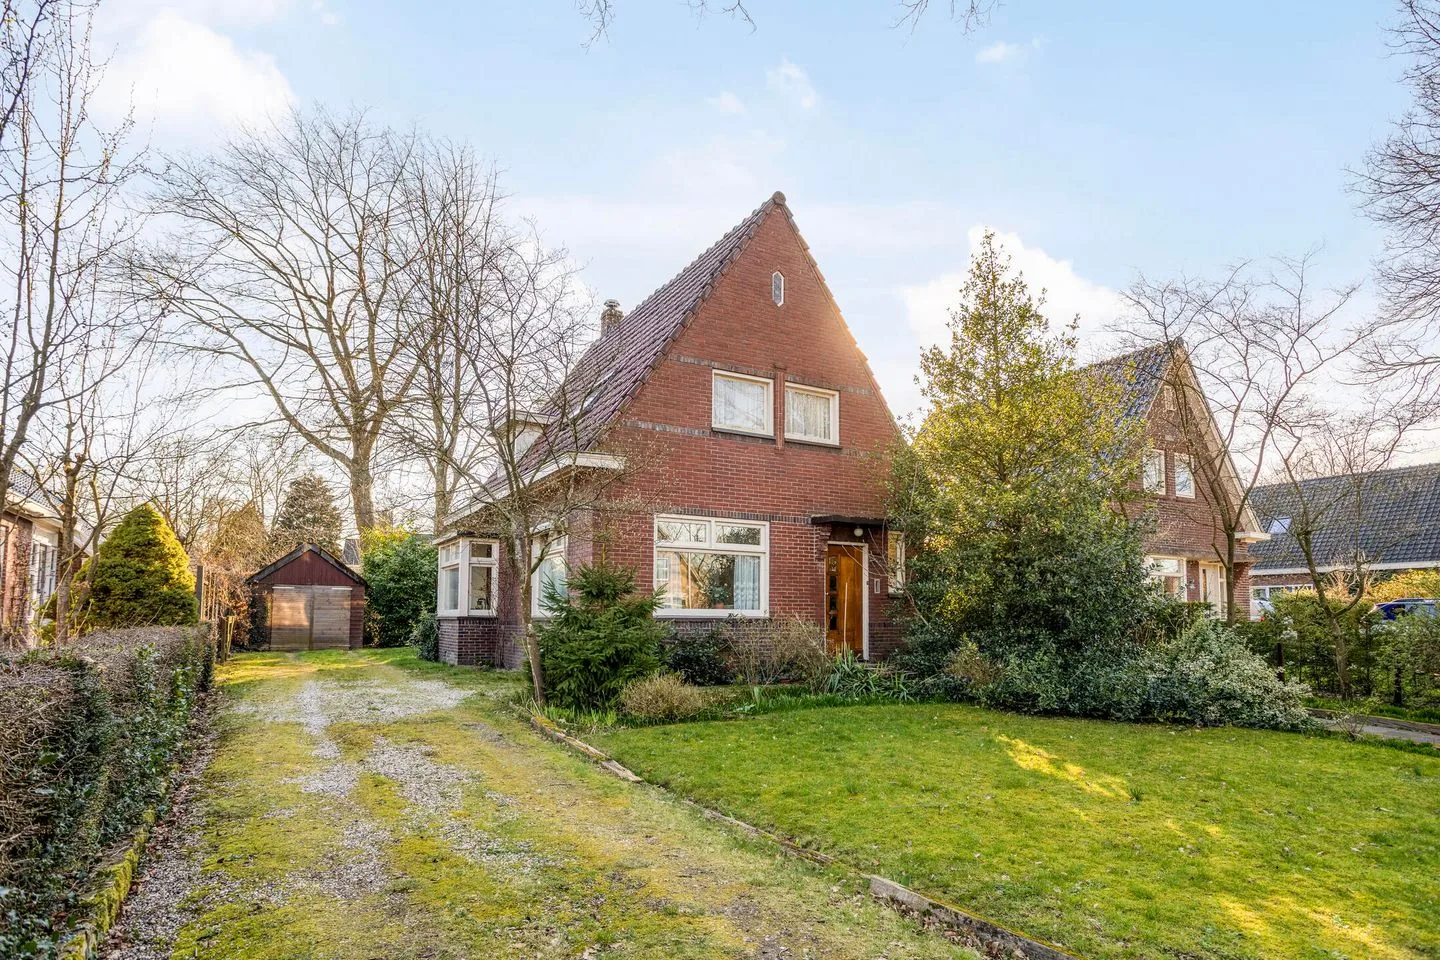
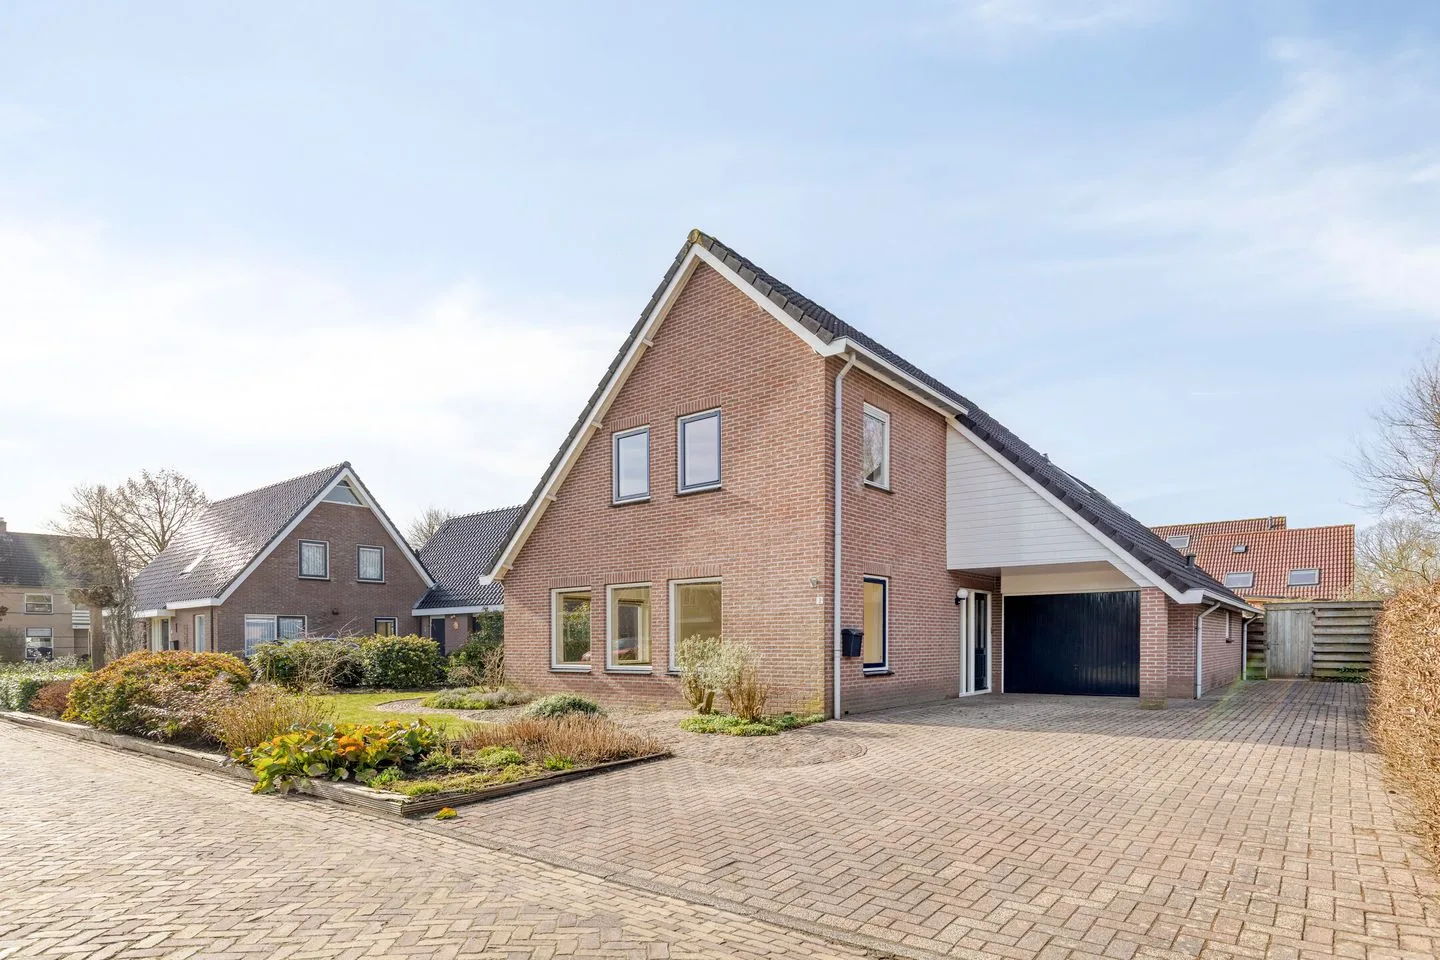
Kampsweg 31
9418PD Wijster
€ 550.000 k.k.
€ 4.074/m²
ESave as favorite- Living area
- 135 m²
- Land area
- 8615 m²
- Bedrooms
- 3
-

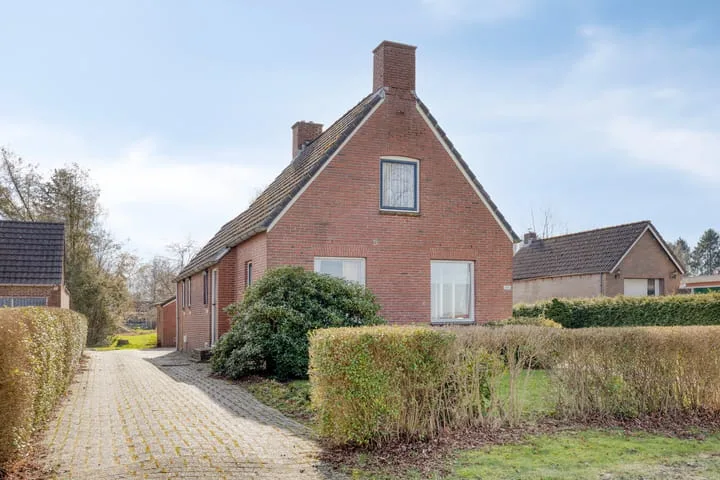
- Available
Hoofdweg 112
9484TB Oudemolen
€ 925.000 k.k.
€ 4.282/m²
FSave as favorite- Living area
- 216 m²
- Land area
- 28600 m²
- Bedrooms
- 8
-

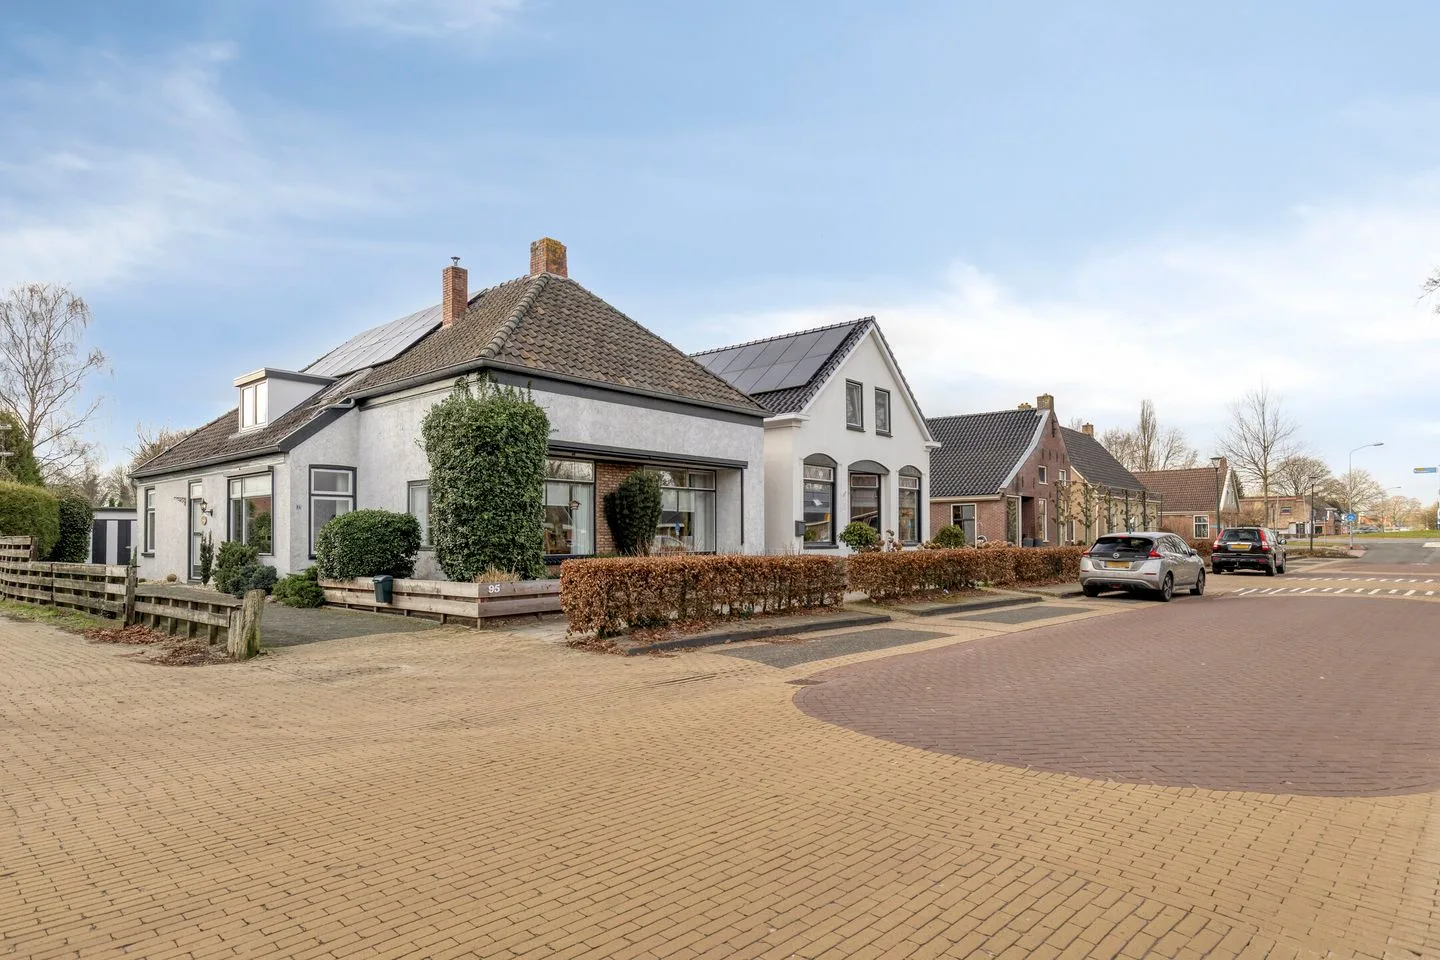
- Available
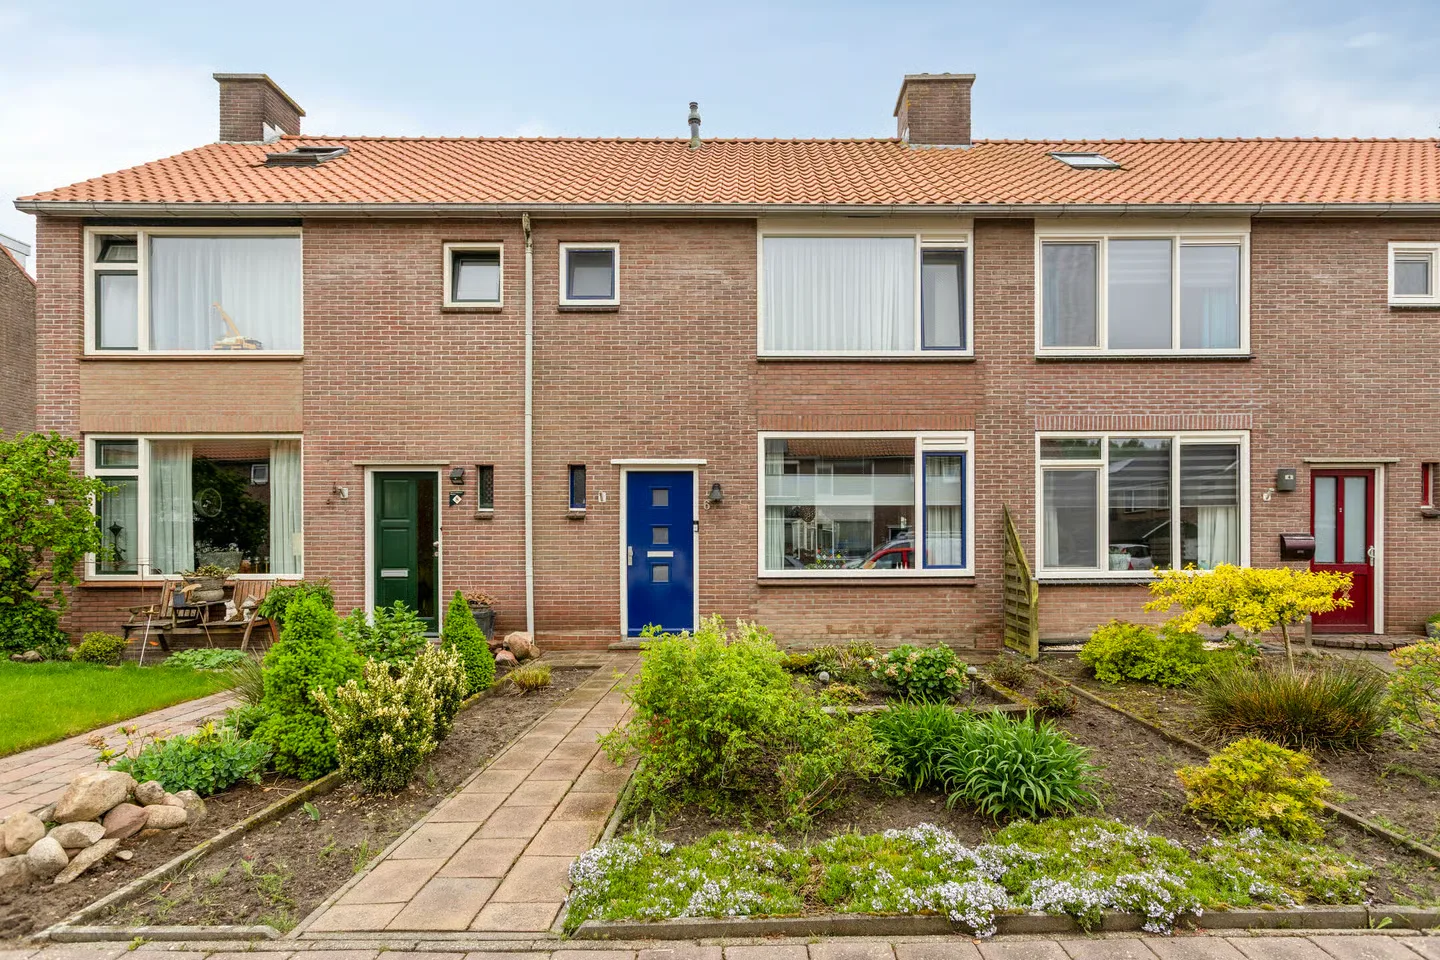
Nijlandstraat 71
9401AC Assen
€ 450.000 k.k.
€ 3.846/m²
ASave as favorite- Living area
- 117 m²
- Land area
- —
- Bedrooms
- 3
-

- Available
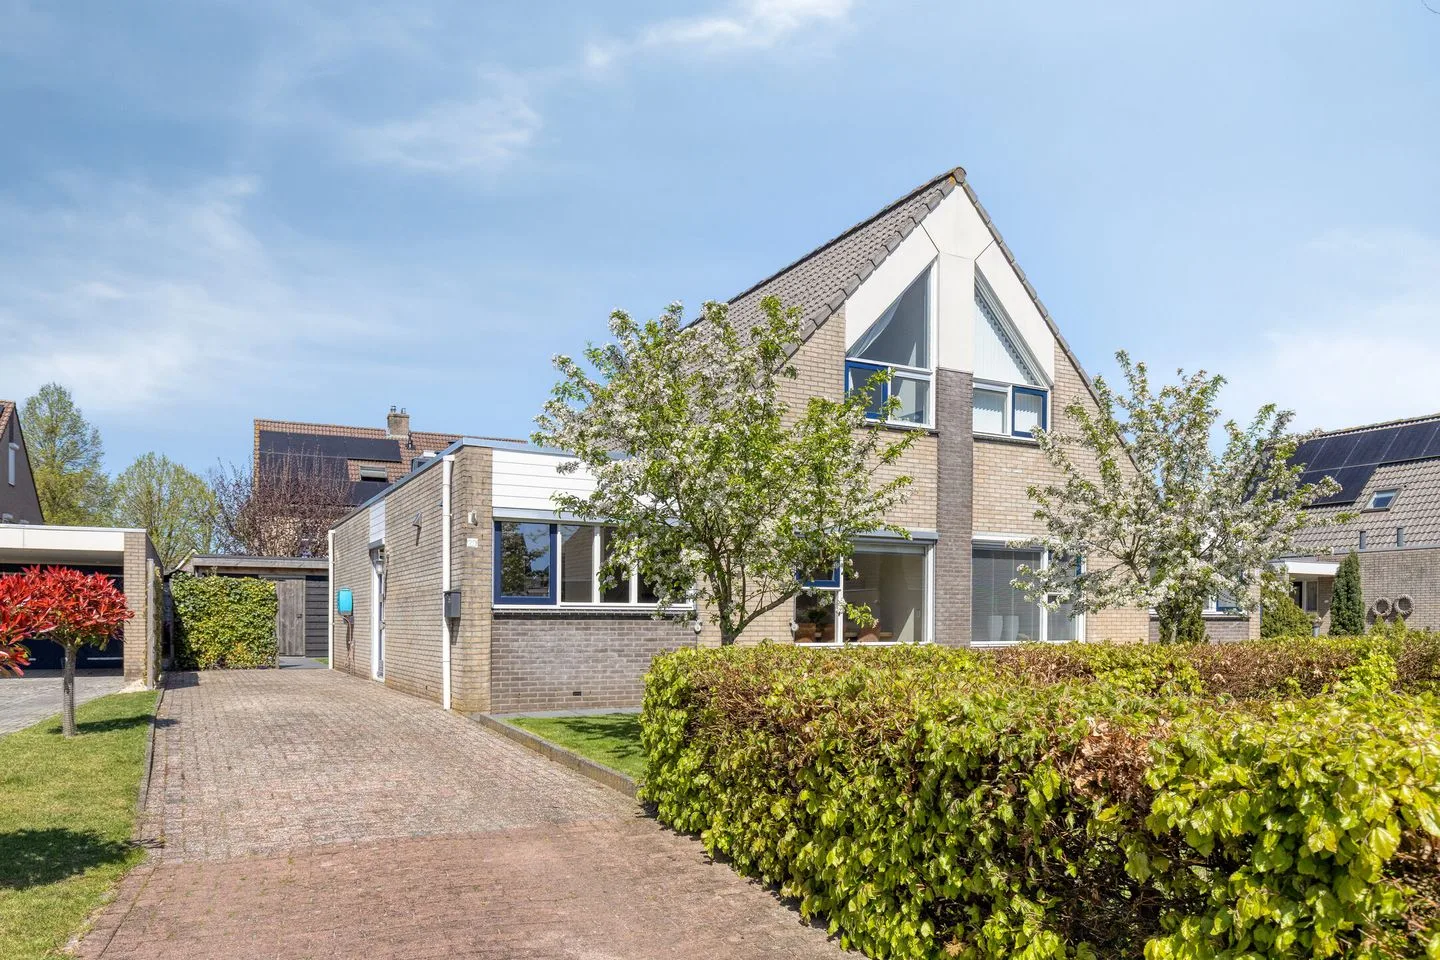
Thorbeckelaan 331
9402DA Assen
€ 392.500 k.k.
€ 4.046/m²
ASave as favorite- Living area
- 97 m²
- Land area
- —
- Bedrooms
- 2
-

- Sold subject to confirmation
Loire 31
9406VA Assen
€ 315.000 k.k.
€ 2.972/m²
CSave as favorite- Living area
- 106 m²
- Land area
- 273 m²
- Bedrooms
- 3
-

- Sold
Drostweg 41
9761CN Eelde
€ 475.000 k.k.
€ 3.084/m²
DSave as favorite- Living area
- 154 m²
- Land area
- 395 m²
- Bedrooms
- 5
Reviews (42)
Review platforms
BronscoresTotal score
42 total reviews

Funda
26 reviews on Funda

16 reviews on Google
-
Hoofdstraat 17 B
9Sander heeft een no nonsens houding. Ik hou ervan. Hij is duidelijk wat hij van jou nodig heeft en verwacht maar heeft zelf een enorme inzet. Hij communiceert snel en adequaat. Hij neemt de tijd voor bezichtigingen en is transparant. Zeker warm aanbevolen.
-
Drostweg 41
10Snel opgepakt. Goede presentatie. Realistisch beeld van markt. Aangename persoonlijkheid. Bedankt Sander
-
Zuidhaege 6
9Met de kennis van de lokale markt wat betreft appartementen heeft de makelaar goed uitgelegd met welke strategie het appartement in de markt te zetten. Met resultaat! Binnen 2 weken verkocht.
-
Oosterhoutstraat 11
10Het waren 2 niet standaard panden, deels met achterstallig onderhoud. Tevens veel grond met erfdienstbaarheid en veel garageboxen. Daarom niet voor iedere koper geschikt, maar uiteindelijk door bemiddeling van de Makelaar toch verkocht.
-
Oosterpark 1
9Translated by AIVery pleasant to deal with, always ready for consultation, gave good advice. Highly recommended!
-
Zuidhaege 80
10Translated by AIGood insight, clear approach with an attractive and fair price (brokerage) model, flexible and customer-oriented, acts on its word and no nonsense.
-
Bosrank 28
9Translated by AIThe real estate agent fully met our expectations. Sander excellently utilized his market knowledge and expertise and carefully guided us throughout the entire sales process. The process proceeded smoothly and efficiently, so we did not experience unnecessary stress.
-
Plataanweg 13
9Translated by AIContact with the real estate agent was quite informal and precisely because of that very smooth. During viewings, he was attentive to (potential) drawbacks, but also positive about the good qualities of a property.
-
Kaarnheugte 30
8Translated by AIIt went well. Good guidance and tips. And also thinking along with you. Investigate things yourself. So that you get a little more peace of mind in your decision to take this step. That makes it clear.
-
Frank
10Translated by AISander is knowledgeable and enjoys thinking along with you! When viewing a property, he paid attention to all (and the smallest) details. Definitely recommended.
-
van Goghstraat 9
9Translated by AISander responds quickly, is easily accessible and very knowledgeable. As a result, he was able to act optimally to purchase the house for us.
-
Van Ostadestraat 8
10Translated by AIHouse was so gone, so that was totally fine! The brochure looked so beautiful that I wanted to buy the house myself :-)
-
Markedreef 27
10Translated by AIPleasant and reliable cooperation.
-
Westeinde 8
9Translated by AIExperienced and fast real estate agent with a keen eye for structural issues and maintenance of the property. This broker is so experienced that he sometimes forgets that the steps to be taken are not as obvious to the buyer as they are to him. Good negotiator, without losing sight of the people on both sides. So far I am very satisfied.
-
Het Bildt 27
9Translated by AIProactive, collaborative, service-oriented, and knowledgeable… in other words, a great experience and a beautiful result as a selling real estate agent!
-
Oosterhoutstraat 84
8Translated by AIProfessional, efficient and knowledgeable. Data is shared securely. Easily accessible.
-
Bosanemoon 57
10Translated by AISander is a no-nonsense agent with extensive market knowledge. Clear agreements ensured that the sale of our house went smoothly.
-
Kloosterheerd 11
10Translated by AIEasy to reach, feeling about what we were looking for. Solid regarding viewing properties with advice. Thorough knowledge of structural matters and easy to consult regarding finalizing an offer.
-
Kleine Veenbes 14
9Translated by AIWe were extremely satisfied with the contact with the real estate agent. Was helpful and gave good advice where needed.
-
Oosterhoutstraat 53
10Translated by AIExpert no nonsense and adequate broker. Realistic approach and guidance. Keeps appointments on time.