- Sold
Van Woustraat 103 4
1074AG Amsterdam
€ 575.000 k.k.
€ 8.333/m²
C
Save as favorite
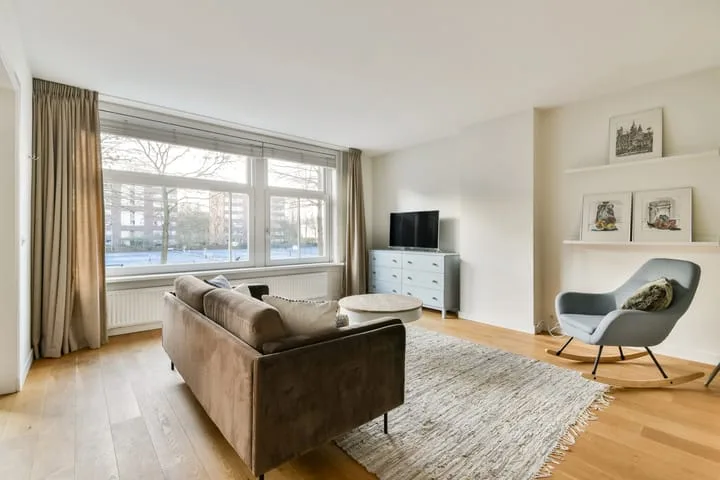
- Living area
- 69 m²
- Land area
- —
- Bedrooms
- 2