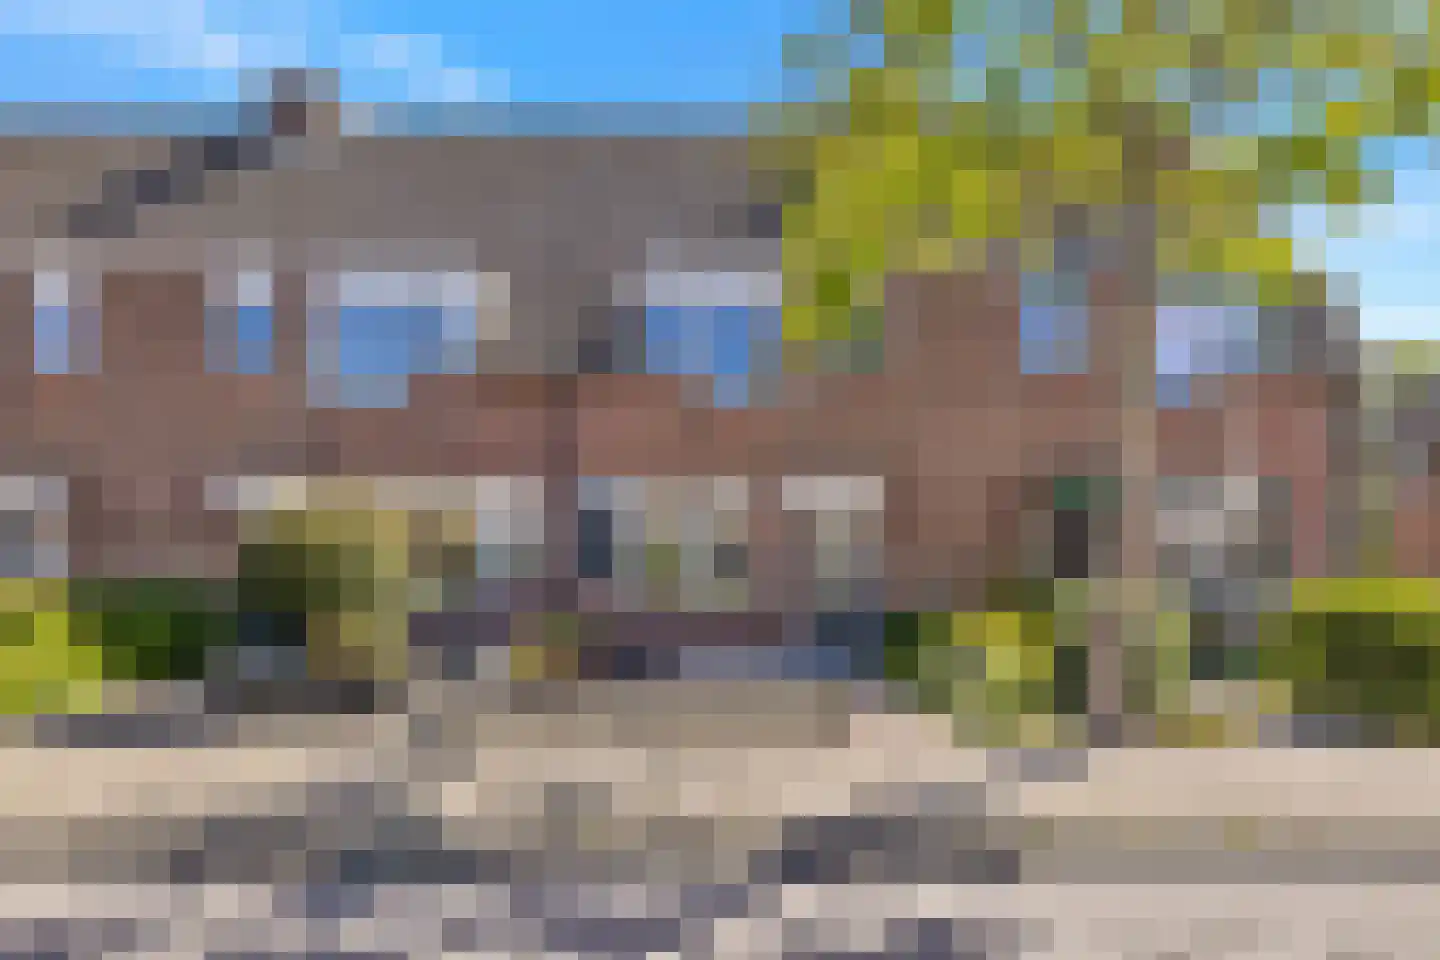
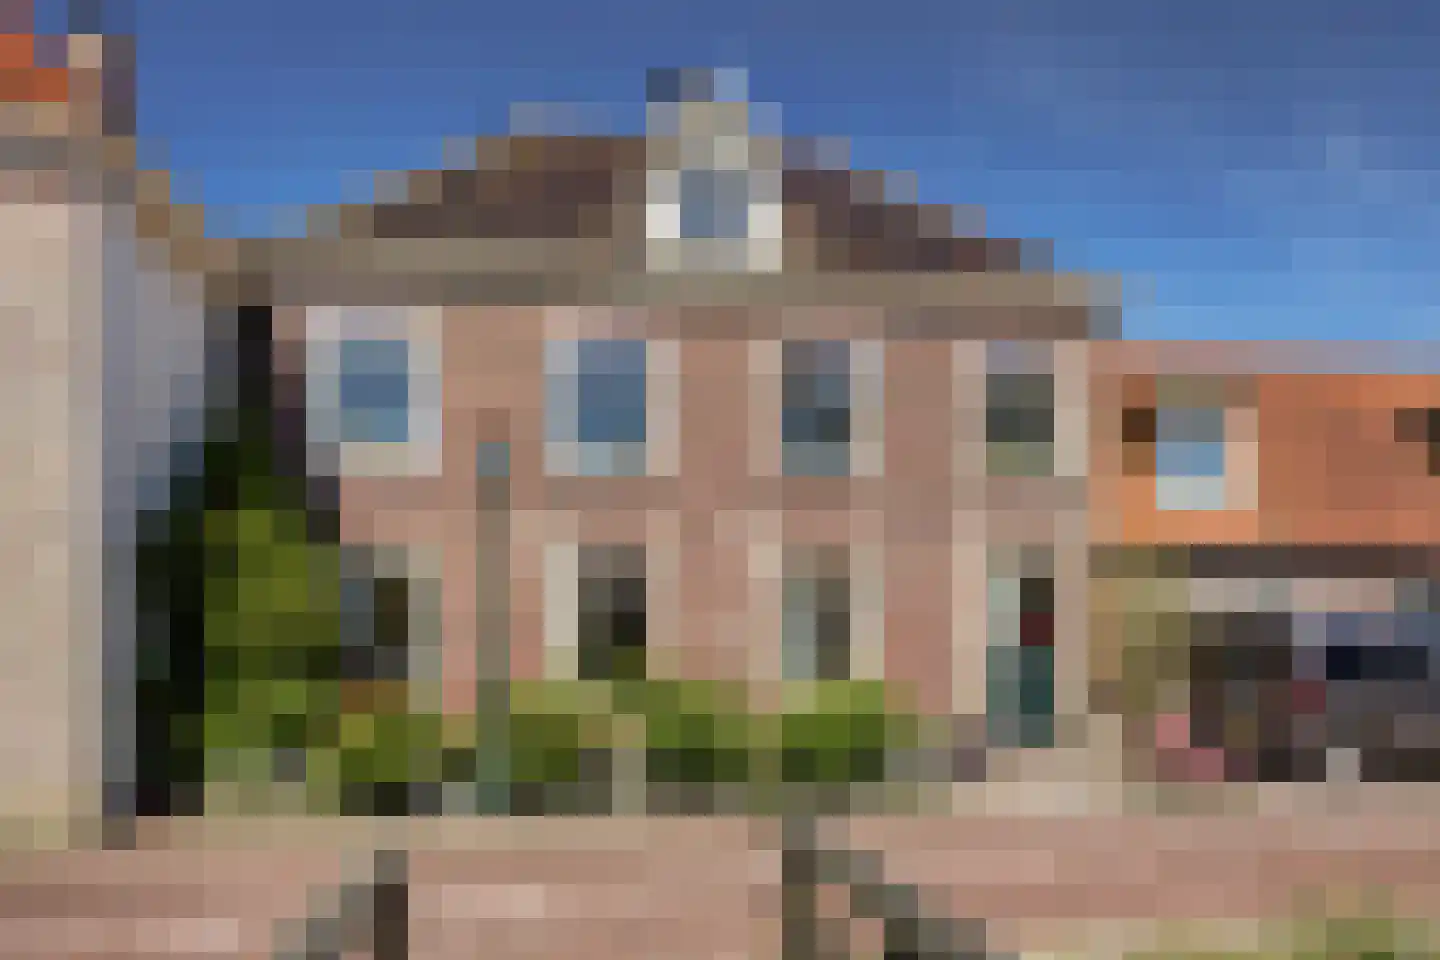
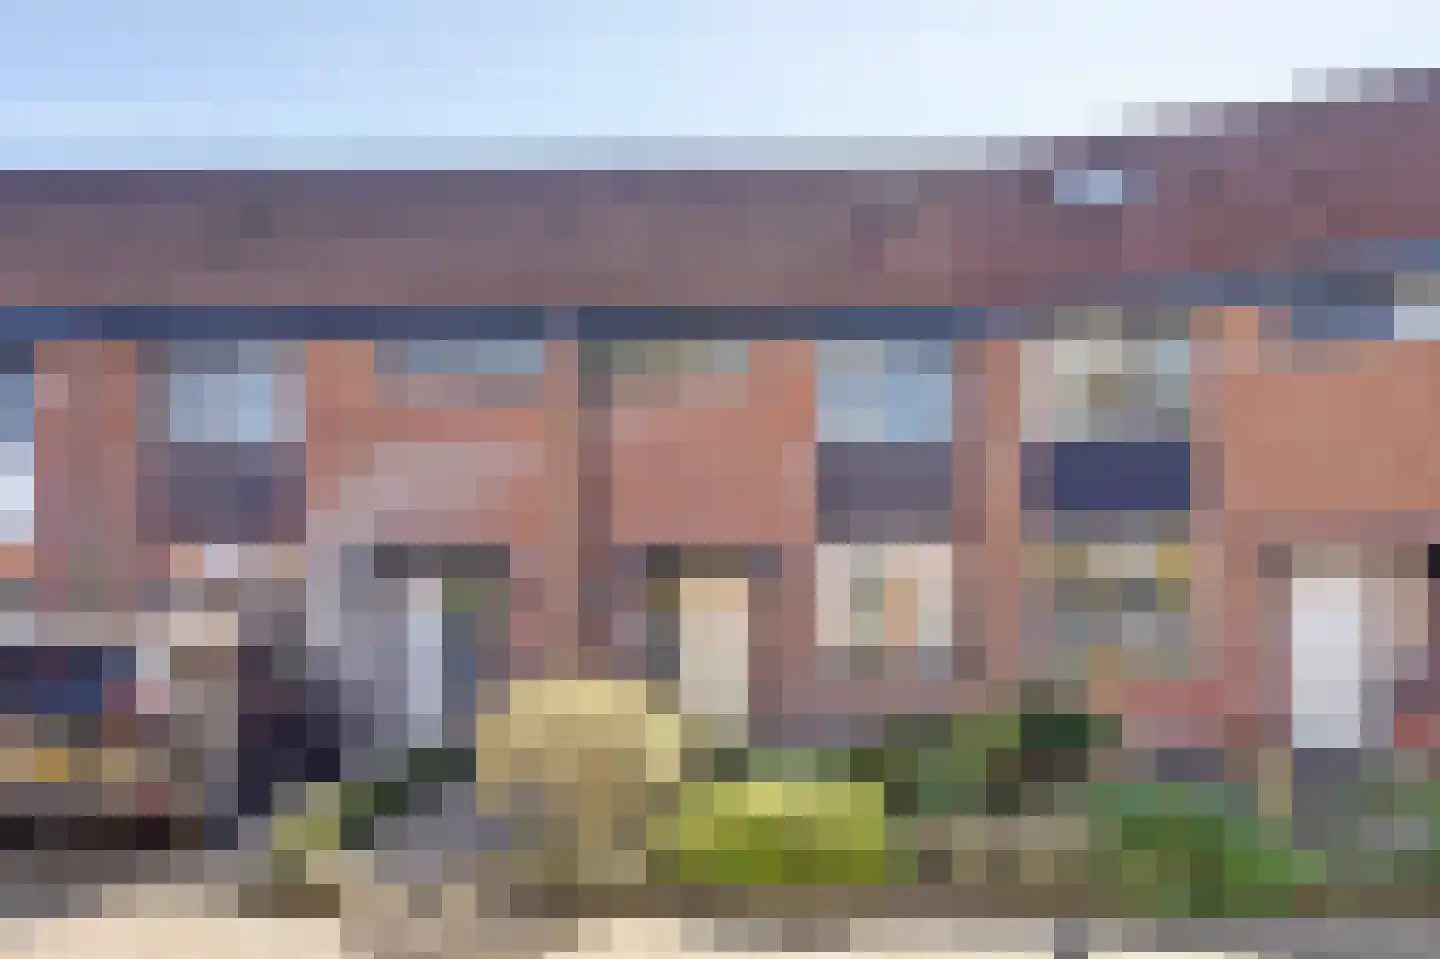
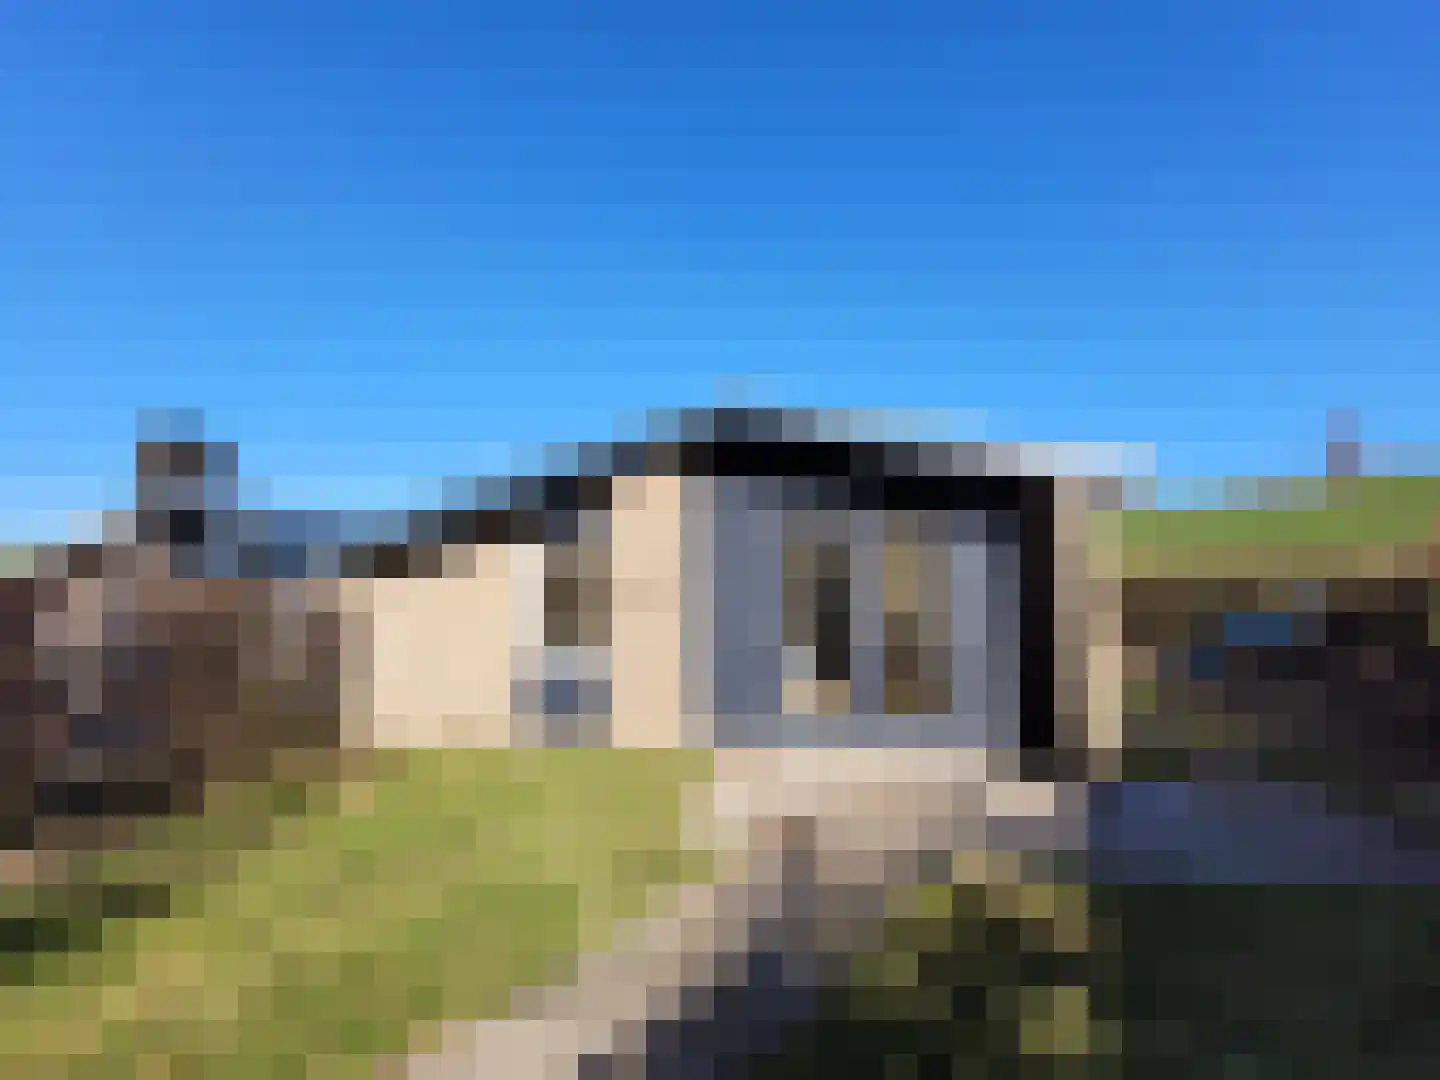
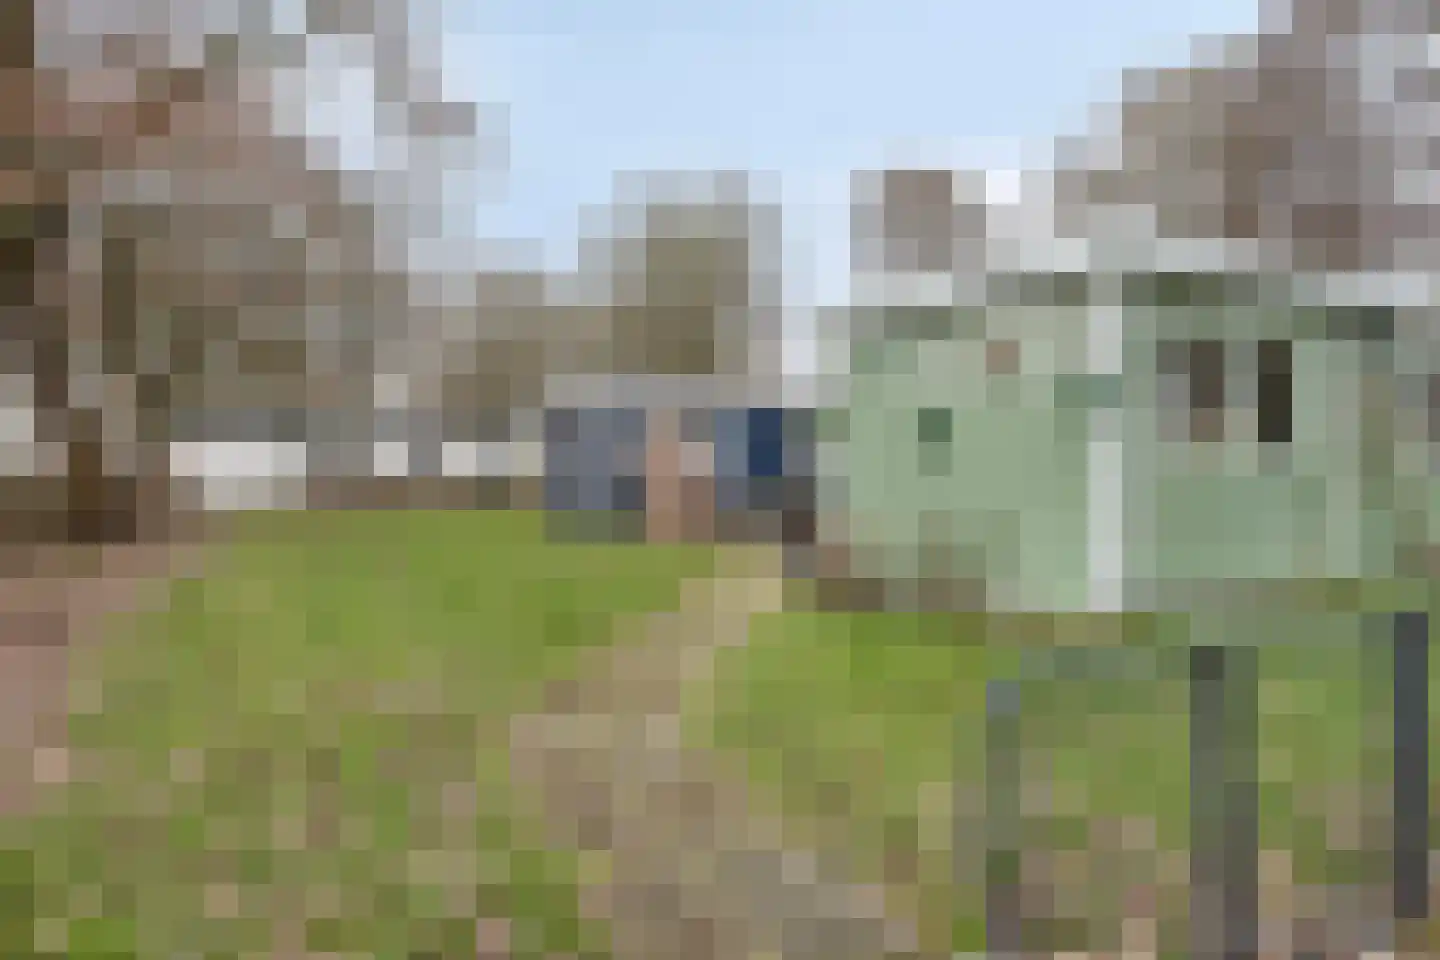
- Available
Middenweg 2 A
1619BL Andijk
€ 165.000 k.k.
- Living area
- —
- Land area
- 235 m²
- Bedrooms
- —
Searching in 72 houses in Andijk
Type to search. Use arrow down and arrow up to navigate through results and press Enter to open.
Hidden search suggestions.
View current properties in Andijk or search targeted on street, postal code and property characteristics.
View the current housing stock in Andijk and quickly filter by price, living area, rooms and more. There are currently 72 houses in this place within our selection. View also 47 sold houses in Andijk for extra insight into the local housing market.
1619BL Andijk
€ 165.000 k.k.
1619BL Andijk
€ 725.000 k.k.
€ 4.475/m²
1619EH Andijk
€ 95.000 k.k.
1619VX Andijk
€ 1.195.000 k.k.
€ 3.983/m²
1619JH Andijk
€ 450.000 k.k.
€ 4.412/m²
1619BZ Andijk
€ 750.000 k.k.
€ 5.034/m²
1619AL Andijk
€ 875.000 k.k.
1619JR Andijk
€ 675.000 k.k.
1619CB Andijk
€ 625.000 k.k.
€ 4.401/m²
1619JA Andijk
€ 699.000 k.k.
€ 3.107/m²
1619XX Andijk
€ 350.000 k.k.
€ 2.692/m²
1619EH Andijk
€ 185.000 k.k.
€ 4.111/m²
1619HJ Andijk
€ 795.000
€ 5.196/m²
1619JA Andijk
€ 975.000 k.k.
€ 3.679/m²
1619CG Andijk
€ 800.000 k.k.
€ 3.791/m²
1619EH Andijk
€ 49.500 k.k.
€ 1.666/m²
1619EH Andijk
€ 97.000 k.k.
€ 2.490/m²
1619CV Andijk
€ 325.000 k.k.
€ 2.731/m²
1619EZ Andijk
€ 400.000 k.k.
€ 3.846/m²
1619DN Andijk
€ 444.000 k.k.
€ 4.229/m²
1619HH Andijk
€ 595.000 k.k.
€ 3.993/m²
1619KC Andijk
€ 495.000 k.k.
€ 3.750/m²
1619JL Andijk
€ 399.000 k.k.
€ 4.807/m²
1619GC Andijk
€ 679.000 k.k.
€ 4.325/m²
1619GP Andijk
€ 545.000 k.k.
€ 2.823/m²
1619KA Andijk
€ 475.000 k.k.
€ 3.275/m²
1619XJ Andijk
€ 259.000 k.k.
€ 4.390/m²
1619VH Andijk
€ 325.000 k.k.
€ 2.579/m²
Get free quotes from real estate agents with local market knowledge. Compare more than 23 real estate agents in Andijk.
Selling a home in Andijk? Compare all real estate agents in Andijk or view the top 10 real estate agents in Andijk for extra context for your choice.
Real estate agents make sharper offers when they know you're comparing — ask for quotes for sale or purchase.
Practical answers about housing supply, sales and comparing real estate agents in Andijk.
The costs of a real estate agent in Andijk depend on commission, setup costs, property presentation and the chosen service. Compare the 23 real estate agents in Andijk via the real estate agent page and request multiple quotes to compare rates and approach well.
Within our selection, we are currently showing 72 houses in Andijk. View also the sold houses in Andijk to compare the current offering with recent transactions.
Take into account not only price and living area but also maintenance, energy label, location, outdoor space and sales status. This way you compare houses in Andijk on more than just the asking price.
A local real estate agent knows the neighborhoods, recent transactions and demand in Andijk. By comparing 23 real estate agents in the region you get a better insight into prices, sales strategy and expected yield; the top 10 in Andijk provides a useful starting point.
Yes, when making a sales plan, a valuation in Andijk is wise. You gain insight into a realistic asking price and can then compare offers from real estate agents specifically.
View current location data on residents, WOZ development, housing stock, energy consumption, business activity and safety in Andijk. In 2025 were there 7.235 residents. The average WOZ value in 2025 is EUR 398.000.
These figures help to better assess and compare the housing stock in Andijk with recent sold homes. Orient yourself then on suitable top real estate agents in Andijk for sales advice in this region.
Residents
7.235
Last year: 2025
Average WOZ
EUR 398.000
Last year: 2025
Average income per person.
EUR 31.800
Source: AllNumbers
Crimes (current year)
137
Total registered
| Year | Residents |
|---|---|
| 2021 | 7.005 |
| 2022 | 7.085 |
| 2023 | 7.200 |
| 2024 | 7.225 |
| 2025 | 7.235 |
| Year | Average WOZ |
|---|---|
| 2021 | EUR 273.000 |
| 2022 | EUR 300.000 |
| 2023 | EUR 356.000 |
| 2024 | EUR 373.000 |
| 2025 | EUR 398.000 |
Hoger
1.070
Praktisch
1.880
Middelbaar
2.440
Europa
930
Nederland
5.785
Buiten Europa
525
Label A
926
Label C
661
Label G
439
Label B
424
Label D
199
Label F
127
Label A++
115
Label A+
69
Label E
64
Label A+++
53
Label A++++
20
Label A+++++
0
| Year | Gas (m3) | Electricity (kWh) |
|---|---|---|
| 2020 | 1.280 | 3.040 |
| 2021 | 1.430 | 3.160 |
| 2022 | 1.090 | 2.960 |
| 2023 | 920 | 2.880 |
| 2024 | 880 | 2.970 |
Hoekwoning
Gas: 820 • Electricity: 2.580
Huurwoning
Gas: 630 • Electricity: 2.250
Koopwoning
Gas: 1.030 • Electricity: 3.120
Appartement
Gas: 520 • Electricity: 1.740
Tussenwoning
Gas: 730 • Electricity: 2.390
Vrijstaande woning
Gas: 1.150 • Electricity: 3.550
Twee-onder-één-kap woning
Gas: 990 • Electricity: 2.950
Total number of company establishments: 1.010
| Period | Crimes |
|---|---|
| jan 2025 | 9 |
| jan 2026 | 21 |
| jul 2025 | 12 |
| jun 2025 | 12 |
| mei 2025 | 18 |
| mrt 2025 | 12 |
| nov 2024 | 13 |
| nov 2025 | 9 |
| okt 2024 | 19 |
| okt 2025 | 10 |
| sep 2024 | 10 |
| sep 2025 | 5 |
These figures give an indicative picture of safety trends in the living environment of Andijk.
Short answers based on current local statistics, handy for a quick comparison of the living environment.
Andijk telt in 2025 ongeveer 7.235 inwoners.
De gemiddelde WOZ-waarde in Andijk is in 2025 circa € 398.000.
Het gemiddelde inkomen per inwoner in Andijk ligt rond € 31.800 per jaar.
Voor het huidige jaar gaat het om ongeveer 137 geregistreerde misdrijven. Gebruik deze cijfers als indicatie en vergelijk trends per periode.
In Andijk komt vooral "Vrijstaande woningen" veel voor, met ongeveer 1.221 woningen.