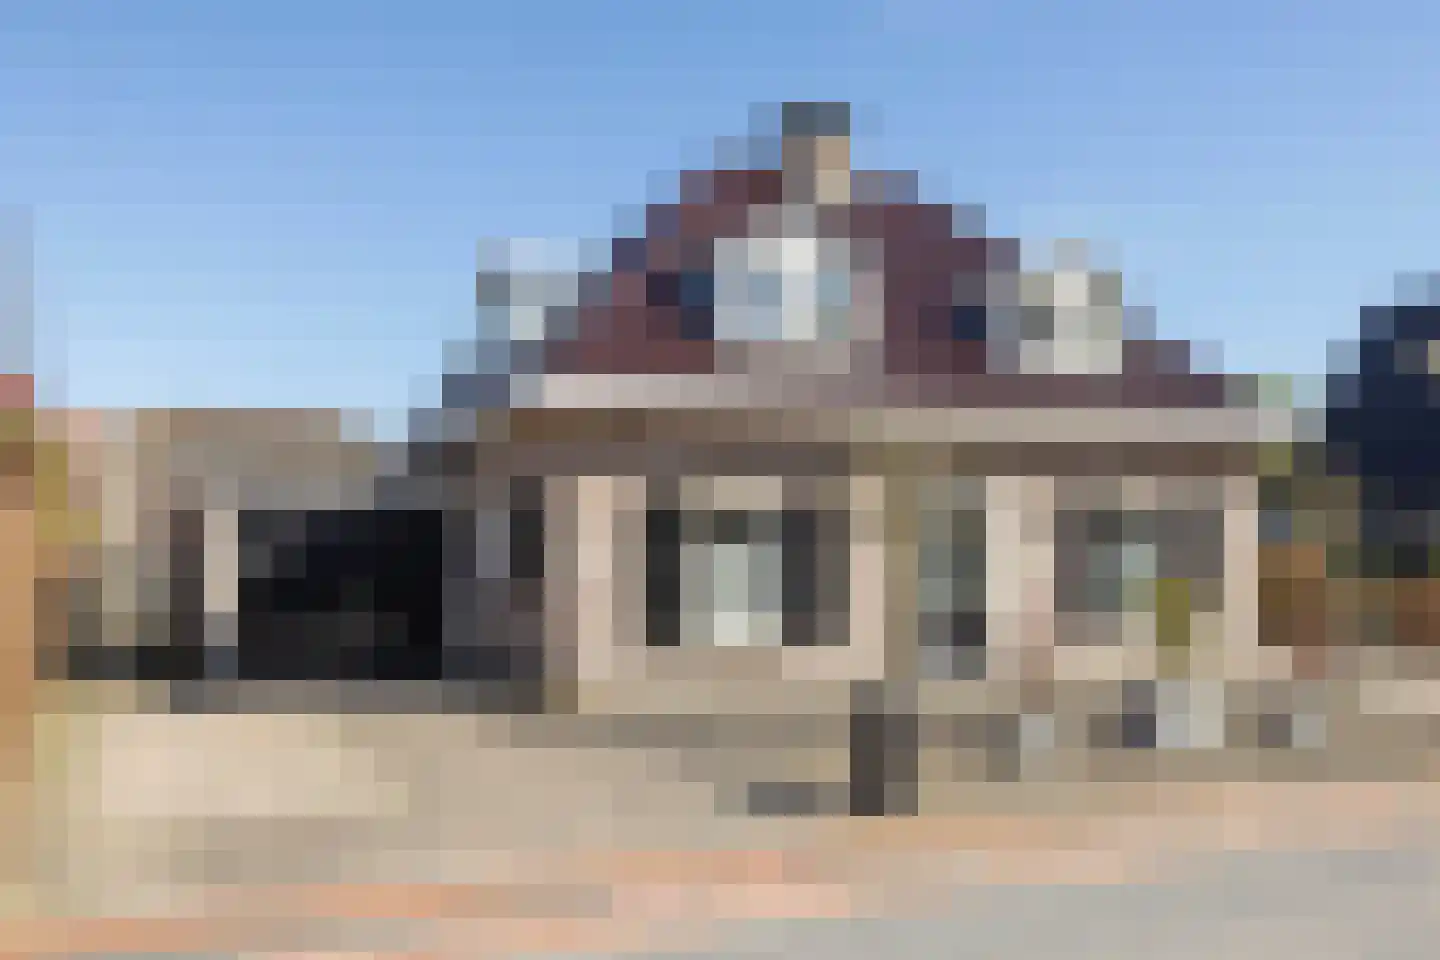
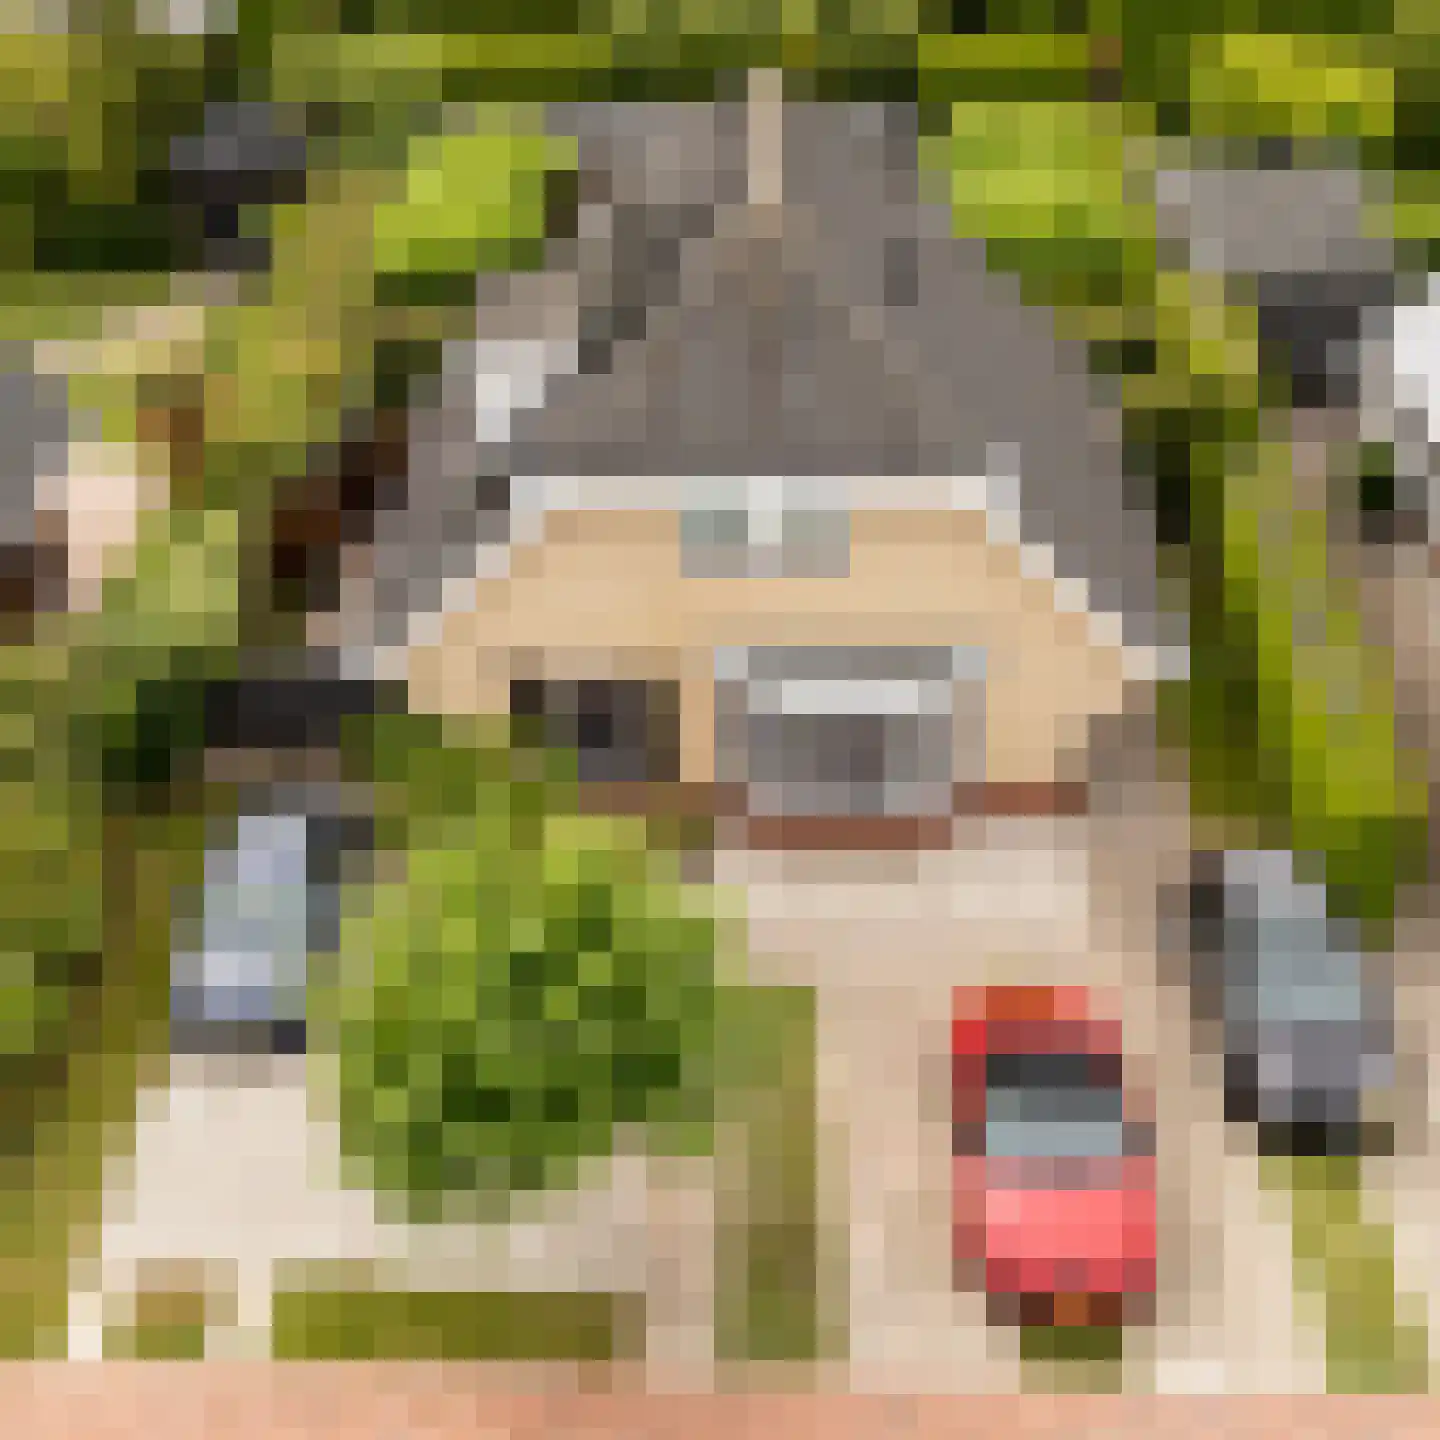
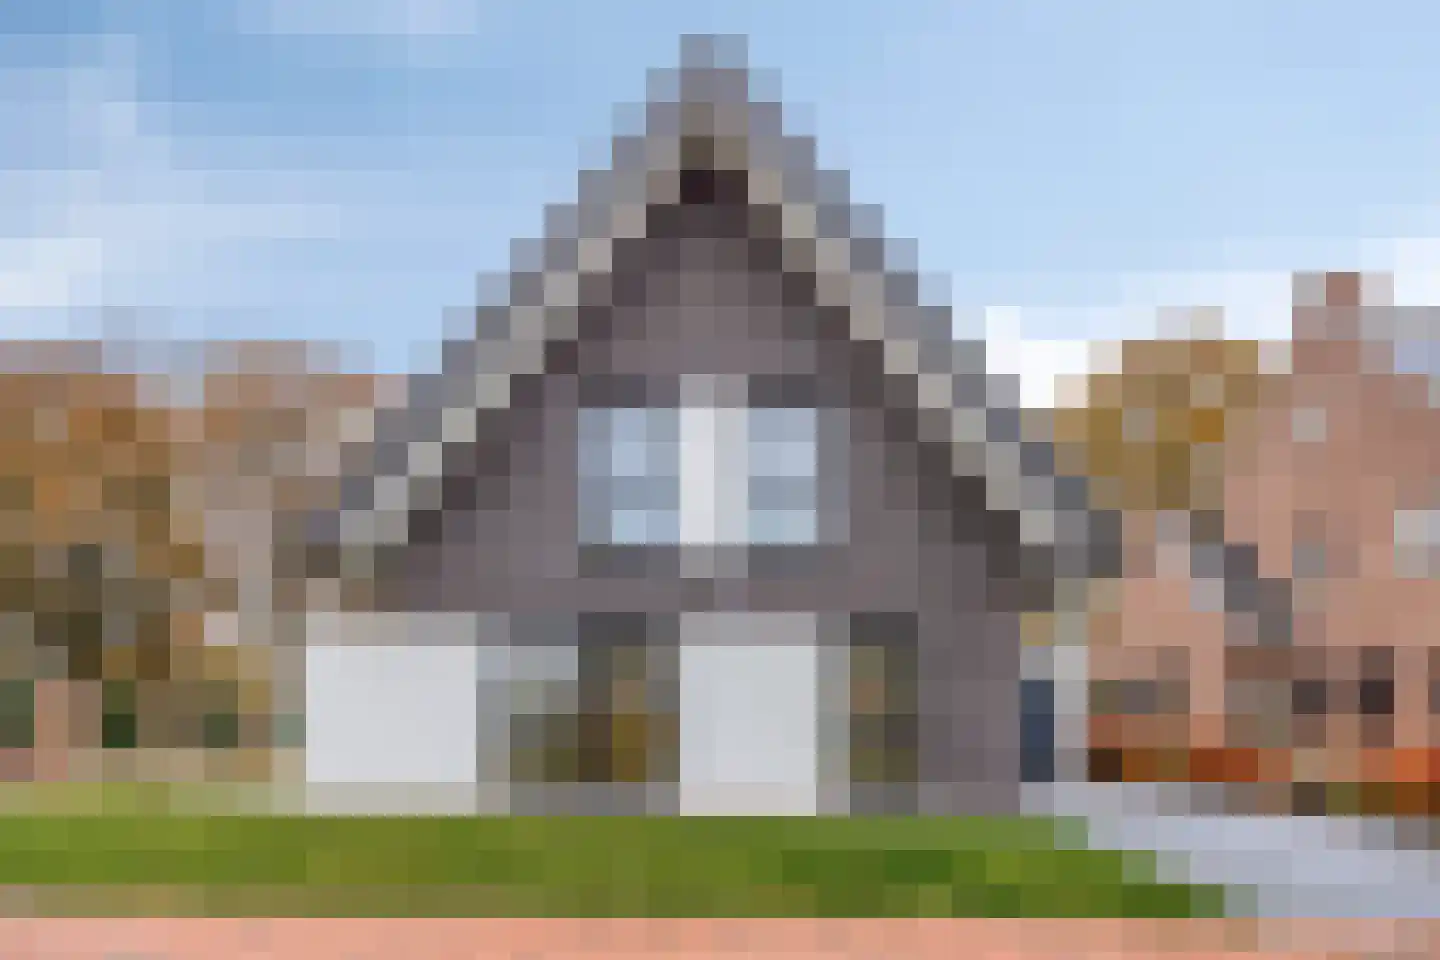
- Sold
Pelmolen 17
7587SG de Lutte
€ 680.000
€ 4.928/m²
- Living area
- 138 m²
- Land area
- 440 m²
- Bedrooms
- 3
View 28 sold houses in De Lutte
Type to search. Use arrow down and arrow up to navigate through results and press Enter to open.
Hidden search suggestions.
Compare sold homes in De Lutte or view the current offering in this location directly.
On this page you will find recently sold homes in De Lutte. Use this overview to better estimate selling prices, popular neighborhoods, and the local housing supply before you choose a real estate agent. Also view the current housing supply with 44 houses in De Lutte.
7587SG de Lutte
€ 680.000
€ 4.928/m²
7587RS de Lutte
€ 565.000 k.k.
€ 4.631/m²
7587AE de Lutte
€ 298.000 k.k.
€ 3.136/m²
7587RK de Lutte
€ 549.000 k.k.
€ 3.287/m²
7587AH de Lutte
€ 389.000 k.k.
€ 3.214/m²
7587RP de Lutte
€ 575.000 k.k.
€ 3.463/m²
7587BM de Lutte
€ 398.000 k.k.
€ 2.926/m²
7587RN de Lutte
Price upon request
7587AG de Lutte
€ 435.000 k.k.
€ 2.471/m²
7587AE de Lutte
€ 419.000 k.k.
€ 2.264/m²
7587RV de Lutte
€ 435.000 k.k.
€ 4.103/m²
7587RV de Lutte
€ 489.000 k.k.
€ 4.486/m²
7587PC de Lutte
Price upon request
7587LH de Lutte
€ 319.000 k.k.
€ 3.752/m²
7587SG de Lutte
€ 845.000 k.k.
€ 0/m²
7587RM de Lutte
€ 630.000
€ 0/m²
7587BH de Lutte
€ 569.000 k.k.
€ 0/m²
7587AT de Lutte
€ 329.000 k.k.
€ 3.781/m²
7587RL de Lutte
€ 525.000 k.k.
€ 4.861/m²
7587RM de Lutte
Price upon request
7587NG de Lutte
€ 595.000 k.k.
€ 2.220/m²
7587AE de Lutte
€ 449.000 k.k.
€ 2.610/m²
7587RW de Lutte
€ 459.000 k.k.
€ 2.781/m²
7587RP de Lutte
€ 585.000 k.k.
€ 4.270/m²
7587SG de Lutte
€ 700.000
€ 5.072/m²
7587BV de Lutte
€ 550.000 k.k.
€ 3.197/m²
7587AT de Lutte
€ 339.000 k.k.
€ 3.291/m²
7587SJ de Lutte
€ 730.000
€ 5.289/m²
Bekijk recente verkopen en ontvang gratis offertes van lokale verkoopmakelaars in De Lutte.
Zelf je woning verkopen in De Lutte? Vergelijk verkoopmakelaars in De Lutte of bekijk de beste verkoopmakelaars in De Lutte als referentie bij jouw keuze.
Makelaars maken scherpere voorstellen als ze weten dat je vergelijkt — vraag offertes aan voor verkoop of aankoop.
Short answers about housing prices, sold homes and comparing real estate agents in De Lutte.
The costs of a real estate agent in De Lutte vary per office, property type and sales approach. Therefore, compare multiple quotes and also look at the real estate agents in De Lutte to better compare rates, presentation and local experience.
On this page we currently show 28 sold houses in De Lutte from our selection. This helps you to better assess recent transactions and the local housing market.
Houses sold in De Lutte give insight into asking prices, house types and neighborhoods where recent transactions have taken place. Compare this also with the current housing stock in De Lutte to better understand the market.
You can use sold homes as a first market indication, but a local real estate agent can better take into account finishing, location, maintenance and current demand in De Lutte.
Vergelijk makelaars in De Lutte op lokale verkoopervaring, reviews, verwachte opbrengst, courtage en marketingaanpak. Bekijk verkoopmakelaars in De Lutte of de top 10 makelaars in De Lutte om snel sterke kantoren te ontdekken.
View current location data on residents, WOZ development, housing stock, energy consumption, business activity and safety in De Lutte. In 2026 were there 4.013 residents. The average WOZ value in 2025 is EUR 496.000.
These figures help to better assess and compare the housing stock in De Lutte with recent sold homes. Orient yourself then on suitable top real estate agents in De Lutte for sales advice in this region.
Residents
4.013
Last year: 2026
Average WOZ
EUR 496.000
Last year: 2025
Average income per person.
EUR 34.600
Source: AllNumbers
Crimes (current year)
132
Total registered
| Year | Residents |
|---|---|
| 2021 | 3.910 |
| 2022 | 3.900 |
| 2023 | 3.970 |
| 2024 | 3.945 |
| 2025 | 3.950 |
| 2026 | 4.013 |
| Year | Average WOZ |
|---|---|
| 2021 | EUR 355.000 |
| 2022 | EUR 396.000 |
| 2023 | EUR 463.000 |
| 2024 | EUR 483.000 |
| 2025 | EUR 496.000 |
Hoger
940
Praktisch
690
Middelbaar
1.350
Europa
315
Nederland
3.545
Buiten Europa
95
Label A
464
Label B
384
Label C
300
Label D
166
Label G
144
Label F
130
Label A+++
91
Label E
67
Label A++
16
Label A+
12
Label A++++
4
Label A+++++
1
| Year | Gas (m3) | Electricity (kWh) |
|---|---|---|
| 2020 | 1.610 | 3.690 |
| 2021 | 1.830 | 3.830 |
| 2022 | 1.430 | 3.570 |
| 2023 | 1.160 | 3.430 |
| 2024 | 1.110 | 3.590 |
Hoekwoning
Gas: 1.000 • Electricity: 2.770
Huurwoning
Gas: 1.130 • Electricity: 2.860
Koopwoning
Gas: 1.170 • Electricity: 3.580
Appartement
Gas: 1.010 • Electricity: 2.990
Tussenwoning
Gas: 890 • Electricity: 2.740
Vrijstaande woning
Gas: 1.270 • Electricity: 3.820
Twee-onder-één-kap woning
Gas: 1.090 • Electricity: 3.030
Total number of company establishments: 615
| Period | Crimes |
|---|---|
| jan 2026 | 12 |
| jul 2025 | 13 |
| jun 2025 | 11 |
| mei 2025 | 13 |
| mrt 2025 | 17 |
| mrt 2026 | 6 |
| nov 2024 | 7 |
| nov 2025 | 9 |
| okt 2024 | 8 |
| okt 2025 | 9 |
| sep 2024 | 6 |
| sep 2025 | 10 |
These figures give an indicative picture of safety trends in the living environment of De Lutte.
Short answers based on current local statistics, handy for a quick comparison of the living environment.
De Lutte telt in 2026 ongeveer 4.013 inwoners.
De gemiddelde WOZ-waarde in De Lutte is in 2025 circa € 496.000.
Het gemiddelde inkomen per inwoner in De Lutte ligt rond € 34.600 per jaar.
Voor het huidige jaar gaat het om ongeveer 132 geregistreerde misdrijven. Gebruik deze cijfers als indicatie en vergelijk trends per periode.
In De Lutte komt vooral "Vrijstaande woningen" veel voor, met ongeveer 961 woningen.