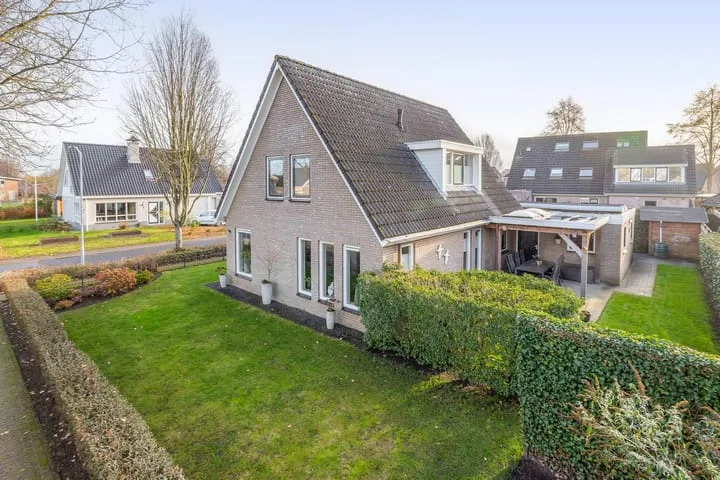
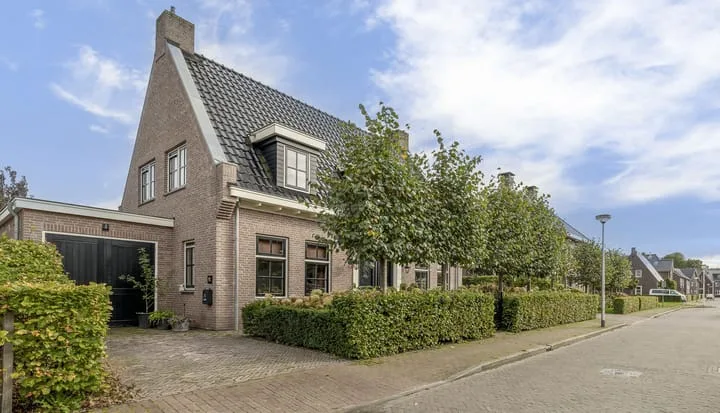
- Sold
Stroovledder 11 a
7991SB Dwingeloo
€ 865.000 k.k.
€ 5.884/m²
- Living area
- 147 m²
- Land area
- 2815 m²
- Bedrooms
- 3
View 31 sold houses in Dwingeloo
Type to search. Use arrow down and arrow up to navigate through results and press Enter to open.
Hidden search suggestions.
Compare sold homes in Dwingeloo or view the current offering in this location directly.
On this page you will find recently sold homes in Dwingeloo. Use this overview to better estimate selling prices, popular neighborhoods, and the local housing supply before you choose a real estate agent. Also view the current housing supply with 56 houses in Dwingeloo.
7991SB Dwingeloo
€ 865.000 k.k.
€ 5.884/m²
7991EJ Dwingeloo
€ 457.500 k.k.
€ 3.630/m²
7991DD Dwingeloo
€ 579.000 k.k.
€ 4.165/m²
7991AL Dwingeloo
€ 355.000 k.k.
€ 5.298/m²
7991AH Dwingeloo
€ 459.500 k.k.
€ 3.235/m²
7991EC Dwingeloo
€ 575.000 k.k.
€ 4.356/m²
7991DA Dwingeloo
€ 495.000 k.k.
€ 3.413/m²
7991AJ Dwingeloo
€ 459.000 k.k.
€ 5.215/m²
7991TA Dwingeloo
€ 749.000 k.k.
€ 3.516/m²
7991AT Dwingeloo
€ 425.000 k.k.
€ 3.346/m²
7991BD Dwingeloo
€ 475.000 k.k.
€ 3.958/m²
7991CX Dwingeloo
€ 495.000 k.k.
€ 5.439/m²
7991EL Dwingeloo
€ 789.500 k.k.
€ 4.934/m²
7991PN Dwingeloo
€ 950.000 k.k.
€ 3.815/m²
7991CM Dwingeloo
€ 675.000 k.k.
€ 4.272/m²
7991PM Dwingeloo
€ 1.250.000 k.k.
€ 4.310/m²
7991CM Dwingeloo
Price upon request
7991AL Dwingeloo
€ 559.500 k.k.
€ 5.180/m²
7991EE Dwingeloo
€ 439.000 k.k.
€ 4.262/m²
7991BP Dwingeloo
€ 798.000 k.k.
€ 3.367/m²
7991CL Dwingeloo
€ 398.500 k.k.
€ 3.435/m²
7991DB Dwingeloo
€ 435.000 k.k.
€ 4.027/m²
7991TN Dwingeloo
€ 945.000 k.k.
€ 5.833/m²
7991CB Dwingeloo
€ 419.500 k.k.
€ 4.877/m²
7991BC Dwingeloo
€ 475.000 k.k.
€ 3.991/m²
7991PV Dwingeloo
€ 1.200.000 k.k.
€ 3.529/m²
7991TM Dwingeloo
€ 750.000 k.k.
€ 6.410/m²
7991CD Dwingeloo
€ 475.000 k.k.
€ 3.830/m²
View recent sales and receive free quotes from local real estate agents. Compare more than 15 real estate agents in Dwingeloo.
Selling your own home in Dwingeloo? Compare real estate agents in Dwingeloo or view the best real estate agents in Dwingeloo as a reference for your choice.
Real estate agents make sharper offers when they know you're comparing — ask for quotes for sale or purchase.
Short answers about housing prices, sold homes and comparing real estate agents in Dwingeloo.
The costs of a real estate agent in Dwingeloo vary per office, property type and sales approach. In Dwingeloo you can compare 15 real estate agents; therefore also look at the real estate agents in Dwingeloo to better compare fees, presentation and local experience.
On this page we currently show 31 sold houses in Dwingeloo from our selection. This helps you to better assess recent transactions and the local housing market.
Houses sold in Dwingeloo give insight into asking prices, house types and neighborhoods where recent transactions have taken place. Compare this also with the current housing stock in Dwingeloo to better understand the market.
You can use sold homes as a first market indication, but a local real estate agent can better take into account finishing, location, maintenance and current demand in Dwingeloo.
Compare the 15 real estate agents in Dwingeloo on local sales experience, reviews, expected yield, commission and marketing approach. View real estate agents in Dwingeloo or the top 10 agents in Dwingeloo to quickly discover strong offices.
View current location data on residents, WOZ development, housing stock, energy consumption, business activity and safety in Dwingeloo. In 2026 were there 4.114 residents. The average WOZ value in 2025 is EUR 438.053.
These figures help to better assess and compare the housing stock in Dwingeloo with recent sold homes. Orient yourself then on suitable top real estate agents in Dwingeloo for sales advice in this region.
Residents
4.114
Last year: 2026
Average WOZ
EUR 438.053
Last year: 2025
Average income per person.
EUR 32.762
Source: AllNumbers
Crimes (current year)
63
Total registered
| Year | Residents |
|---|---|
| 2021 | 4.146 |
| 2022 | 4.140 |
| 2023 | 4.119 |
| 2024 | 4.208 |
| 2025 | 4.215 |
| 2026 | 4.114 |
| Year | Average WOZ |
|---|---|
| 2021 | EUR 317.188 |
| 2022 | EUR 341.452 |
| 2023 | EUR 385.683 |
| 2024 | EUR 403.925 |
| 2025 | EUR 438.053 |
Hoger
728
Praktisch
529
Middelbaar
1.081
Europa
176
Nederland
3.845
Buiten Europa
192
Label C
404
Label B
353
Label G
344
Label A
332
Label D
188
Label F
151
Label E
71
Label A+++
20
Label A+
11
Label A++
10
Label A++++
9
Label A+++++
1
| Year | Gas (m3) | Electricity (kWh) |
|---|---|---|
| 2020 | 1.675 | 3.193 |
| 2021 | 1.877 | 3.322 |
| 2022 | 1.467 | 3.136 |
| 2023 | 1.201 | 2.978 |
| 2024 | 1.132 | 3.088 |
Hoekwoning
Gas: 632 • Electricity: 1.202
Huurwoning
Gas: 872 • Electricity: 1.834
Koopwoning
Gas: 1.268 • Electricity: 3.266
Appartement
Gas: 601 • Electricity: 1.374
Tussenwoning
Gas: 545 • Electricity: 1.277
Vrijstaande woning
Gas: 1.414 • Electricity: 3.502
Twee-onder-één-kap woning
Gas: 835 • Electricity: 2.183
Total number of company establishments: 695
| Period | Crimes |
|---|---|
| jan 2026 | 5 |
| jul 2025 | 6 |
| jun 2025 | 5 |
| mei 2025 | 9 |
| mrt 2025 | 8 |
| mrt 2026 | 8 |
| nov 2024 | 5 |
| nov 2025 | 5 |
| okt 2024 | 6 |
| okt 2025 | 4 |
| sep 2024 | 3 |
| sep 2025 | 4 |
These figures give an indicative picture of safety trends in the living environment of Dwingeloo.
Short answers based on current local statistics, handy for a quick comparison of the living environment.
Dwingeloo telt in 2026 ongeveer 4.114 inwoners.
De gemiddelde WOZ-waarde in Dwingeloo is in 2025 circa € 438.053.
Het gemiddelde inkomen per inwoner in Dwingeloo ligt rond € 32.762 per jaar.
Voor het huidige jaar gaat het om ongeveer 63 geregistreerde misdrijven. Gebruik deze cijfers als indicatie en vergelijk trends per periode.
In Dwingeloo komt vooral "Vrijstaande woningen" veel voor, met ongeveer 978 woningen.