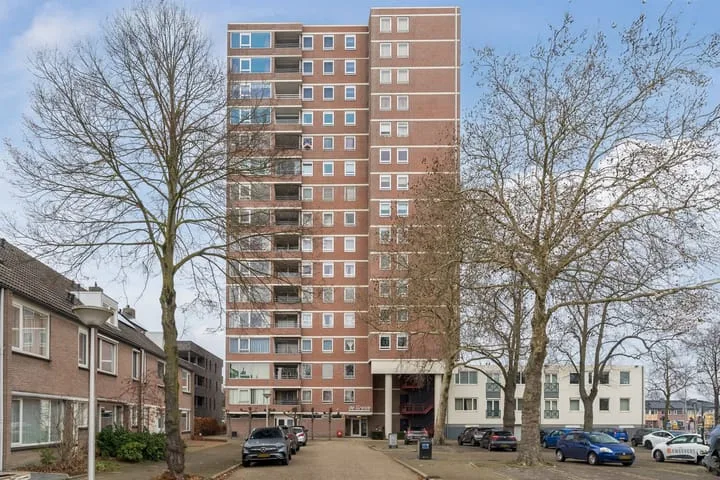
- Sold
Geldropseweg 220
5643TP Eindhoven
€ 300.000 k.k.
€ 5.357/m²
- Living area
- 56 m²
- Land area
- —
- Bedrooms
- 1
View 2.191 sold houses in Eindhoven
Type to search. Use arrow down and arrow up to navigate through results and press Enter to open.
Hidden search suggestions.
Compare sold homes in Eindhoven or view the current offering in this location directly.
On this page you will find recently sold homes in Eindhoven. Use this overview to better estimate selling prices, popular neighborhoods, and the local housing supply before you choose a real estate agent. Also view the current housing supply with 3.378 houses in Eindhoven.
5643TP Eindhoven
€ 300.000 k.k.
€ 5.357/m²
5642NE Eindhoven
€ 465.000 k.k.
€ 5.054/m²
5623AW Eindhoven
€ 359.000 k.k.
€ 4.786/m²
5623JR Eindhoven
€ 495.000 k.k.
€ 6.036/m²
5628PB Eindhoven
€ 435.000 k.k.
€ 3.990/m²
5629KN Eindhoven
€ 631.000 k.k.
€ 5.684/m²
5622NE Eindhoven
€ 365.000 k.k.
€ 4.451/m²
5613JR Eindhoven
€ 310.000 k.k.
€ 3.780/m²
5632NM Eindhoven
€ 389.000 k.k.
€ 4.182/m²
5651AE Eindhoven
€ 315.000 k.k.
€ 5.526/m²
5629MP Eindhoven
Price upon request
5625WH Eindhoven
€ 370.000 k.k.
€ 4.302/m²
5615EC Eindhoven
€ 1.350.000 k.k.
€ 7.541/m²
5616BE Eindhoven
€ 598.000 k.k.
€ 3.646/m²
5611HW Eindhoven
€ 525.000 k.k.
€ 5.585/m²
5615HB Eindhoven
€ 650.000 k.k.
€ 4.814/m²
5632MB Eindhoven
€ 280.000 k.k.
€ 2.592/m²
5643ND Eindhoven
€ 589.000 k.k.
€ 4.530/m²
5641AB Eindhoven
€ 635.000 k.k.
€ 4.290/m²
5613LV Eindhoven
€ 470.000 k.k.
€ 5.402/m²
5616JK Eindhoven
€ 575.000 k.k.
€ 5.088/m²
5611PE Eindhoven
€ 374.500 k.k.
€ 5.427/m²
5622KM Eindhoven
€ 449.000 k.k.
€ 6.701/m²
5611PN Eindhoven
€ 475.000 k.k.
€ 5.588/m²
5629PB Eindhoven
€ 495.000 k.k.
€ 4.583/m²
5631BW Eindhoven
€ 475.000 k.k.
€ 5.459/m²
5654GJ Eindhoven
€ 430.000 k.k.
€ 4.018/m²
5627BE Eindhoven
€ 445.000 k.k.
€ 4.238/m²
Get free quotes from realtors with local market knowledge in Eindhoven.
Selling a home in Eindhoven? Compare real estate agents who know the local housing market. Also check out all real estate agents in Eindhoven or the top 10 real estate agents in Eindhoven for extra context for your choice.
By comparing brokers and requesting quotes
Short answers about housing prices, sold homes and comparing real estate agents in Eindhoven.
The costs of a real estate agent in Eindhoven vary per office, property type and sales approach. Therefore, compare multiple quotes and also look at the real estate agents in Eindhoven to better compare rates, presentation and local experience.
On this page we currently show 2.191 sold houses in Eindhoven from our selection. This helps you to better assess recent transactions and the local housing market.
Houses sold in Eindhoven give insight into asking prices, house types and neighborhoods where recent transactions have taken place. Compare this also with the current housing stock in Eindhoven to better understand the market.
You can use sold homes as a first market indication, but a local real estate agent can better take into account finishing, location, maintenance and current demand in Eindhoven.
Compare realtors in Eindhoven on local sales experience, reviews, expected yield, commission and marketing approach. The top 10 realtors in Eindhoven helps to quickly discover strong offices.
View current location data on residents, WOZ development, housing stock, energy consumption, business activity and safety in Eindhoven. In 2026 were there 249.873 residents. The average WOZ value in 2025 is EUR 391.000.
These figures help to better assess and compare the housing stock in Eindhoven with recent sold homes. Orient yourself then on suitable top real estate agents in Eindhoven for sales advice in this region.
Residents
249.873
Last year: 2026
Average WOZ
EUR 391.000
Last year: 2025
Average income per person.
EUR 36.400
Source: AllNumbers
Crimes (current year)
18.880
Total registered
| Year | Residents |
|---|---|
| 2022 | 238.326 |
| 2023 | 243.730 |
| 2024 | 246.417 |
| 2025 | 249.035 |
| 2026 | 249.873 |
| Year | Average WOZ |
|---|---|
| 2021 | EUR 287.000 |
| 2022 | EUR 314.000 |
| 2023 | EUR 360.000 |
| 2024 | EUR 363.000 |
| 2025 | EUR 391.000 |
Hoger
43
Praktisch
24
Middelbaar
34
Europa
36.936
Nederland
134.959
Buiten Europa
77.140
Label A
34.103
Label C
29.742
Label B
19.304
Label D
11.177
Label E
9.327
Label F
6.306
Label A+
5.788
Label G
4.088
Label A++
3.731
Label A+++
2.635
Label A++++
578
Label A+++++
42
| Year | Gas (m3) | Electricity (kWh) |
|---|---|---|
| 2020 | 1.040 | 2.540 |
| 2021 | 1.140 | 2.570 |
| 2022 | 900 | 2.400 |
| 2023 | 770 | 2.270 |
| 2024 | 750 | 2.310 |
Hoekwoning
Gas: 970 • Electricity: 2.650
Huurwoning
Gas: 670 • Electricity: 1.900
Koopwoning
Gas: 890 • Electricity: 2.740
Appartement
Gas: 550 • Electricity: 1.710
Tussenwoning
Gas: 830 • Electricity: 2.450
Vrijstaande woning
Gas: 1.400 • Electricity: 4.320
Twee-onder-één-kap woning
Gas: 1.210 • Electricity: 3.250
Total number of company establishments: 33.545
| Period | Crimes |
|---|---|
| jan 2025 | 1.526 |
| jan 2026 | 1.357 |
| jul 2025 | 1.556 |
| jun 2025 | 1.564 |
| mei 2025 | 1.610 |
| mrt 2025 | 1.666 |
| nov 2024 | 1.768 |
| nov 2025 | 1.541 |
| okt 2024 | 1.807 |
| okt 2025 | 1.706 |
| sep 2024 | 1.612 |
| sep 2025 | 1.579 |
These figures give an indicative picture of safety trends in the living environment of Eindhoven.
Short answers based on current local statistics, handy for a quick comparison of the living environment.
Eindhoven telt in 2026 ongeveer 249.873 inwoners.
De gemiddelde WOZ-waarde in Eindhoven is in 2025 circa € 391.000.
Het gemiddelde inkomen per inwoner in Eindhoven ligt rond € 36.400 per jaar.
Voor het huidige jaar gaat het om ongeveer 18.880 geregistreerde misdrijven. Gebruik deze cijfers als indicatie en vergelijk trends per periode.
In Eindhoven komt vooral "Appartementen" veel voor, met ongeveer 58.911 woningen.