- Available
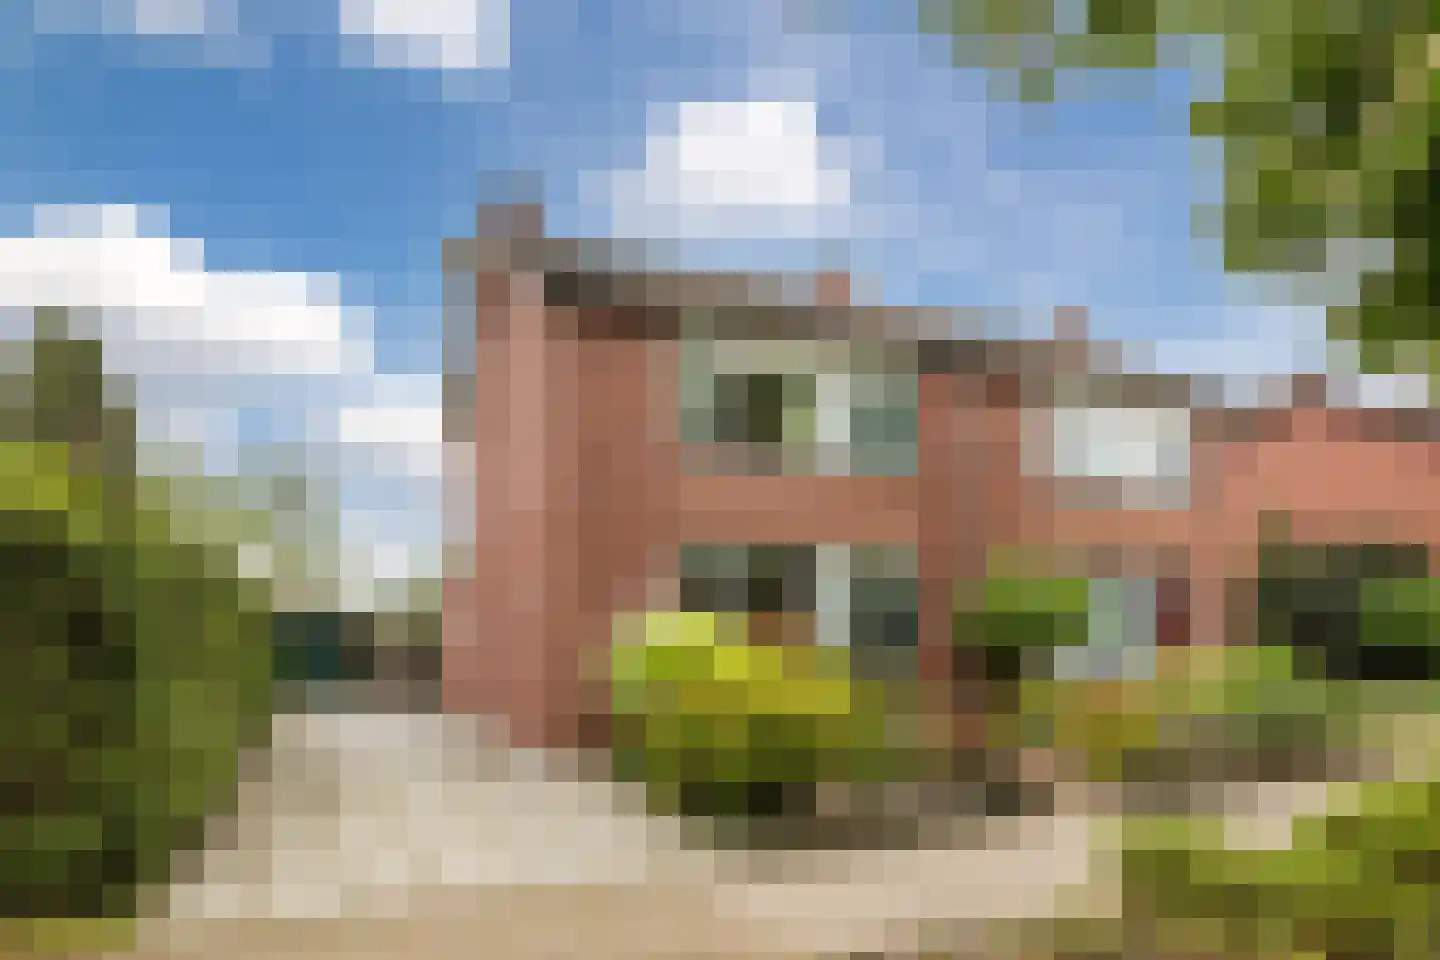
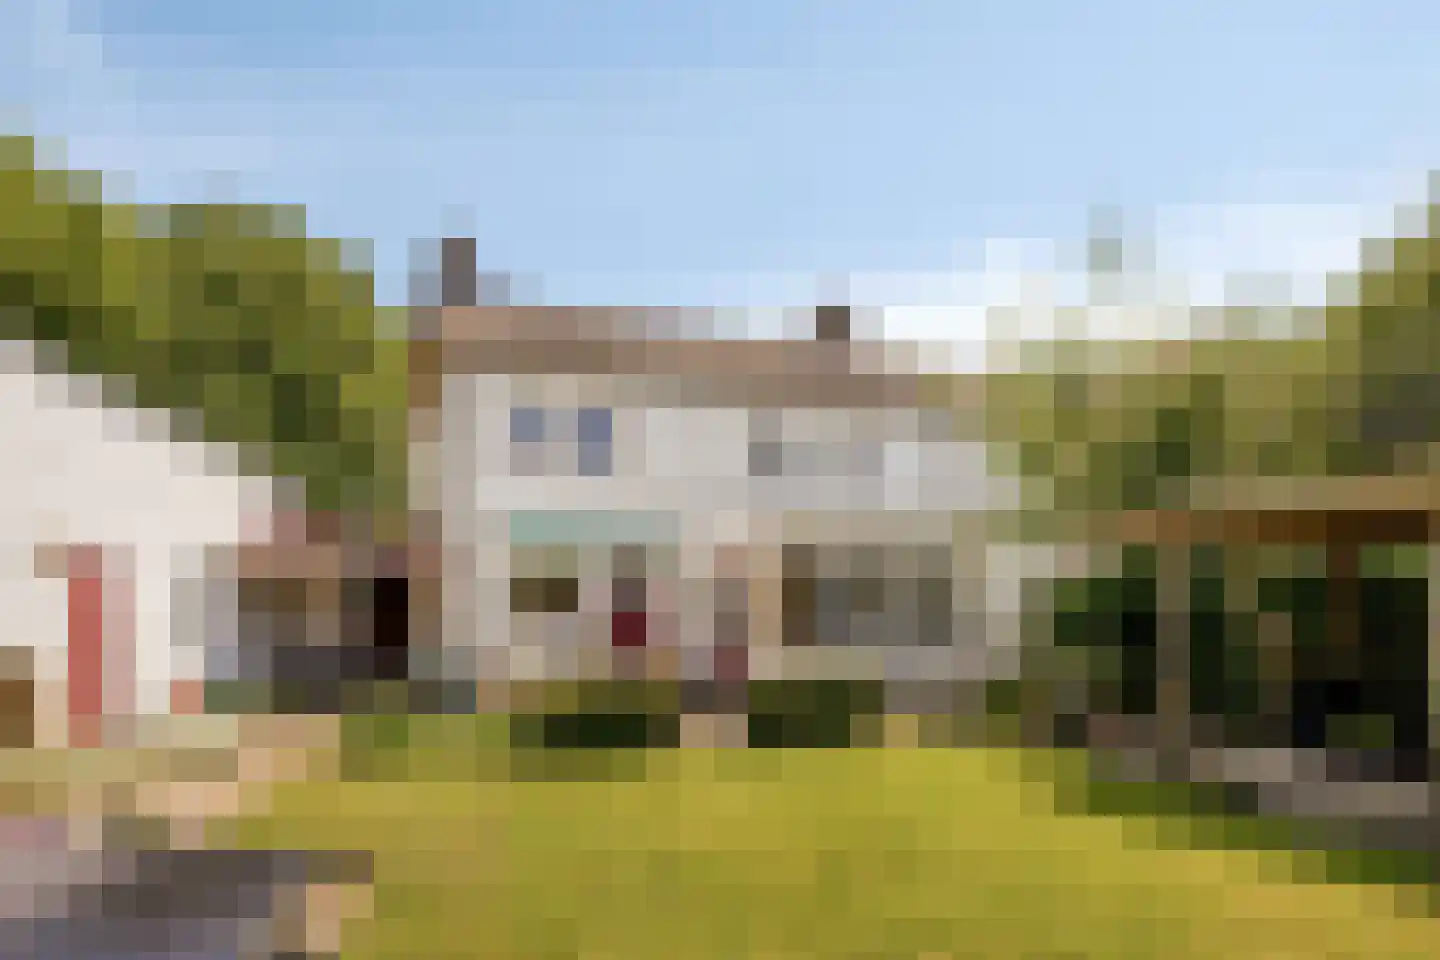
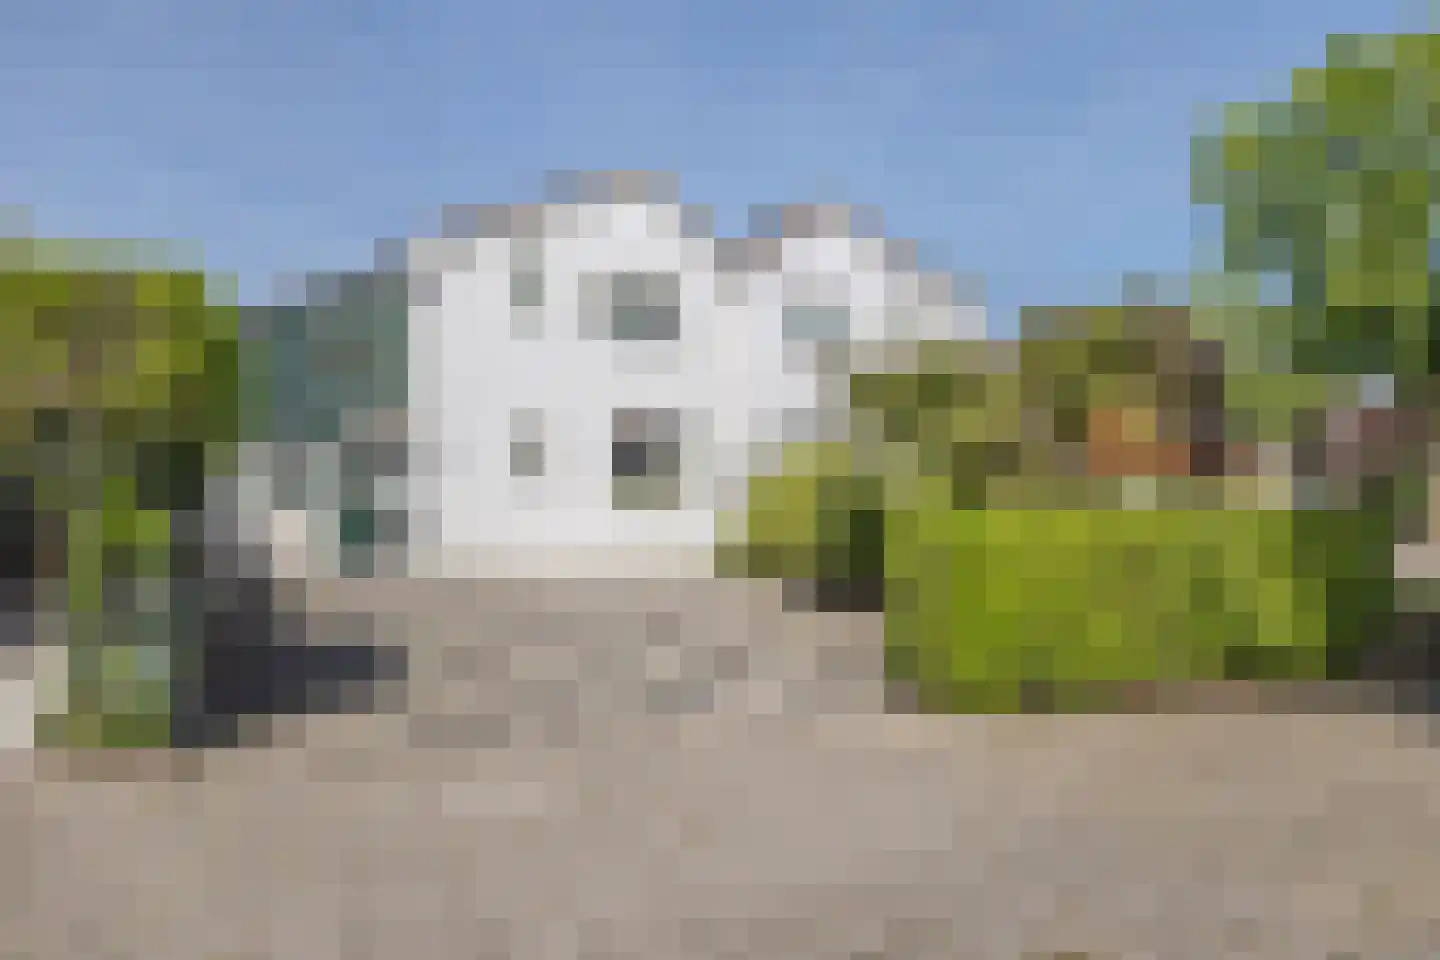
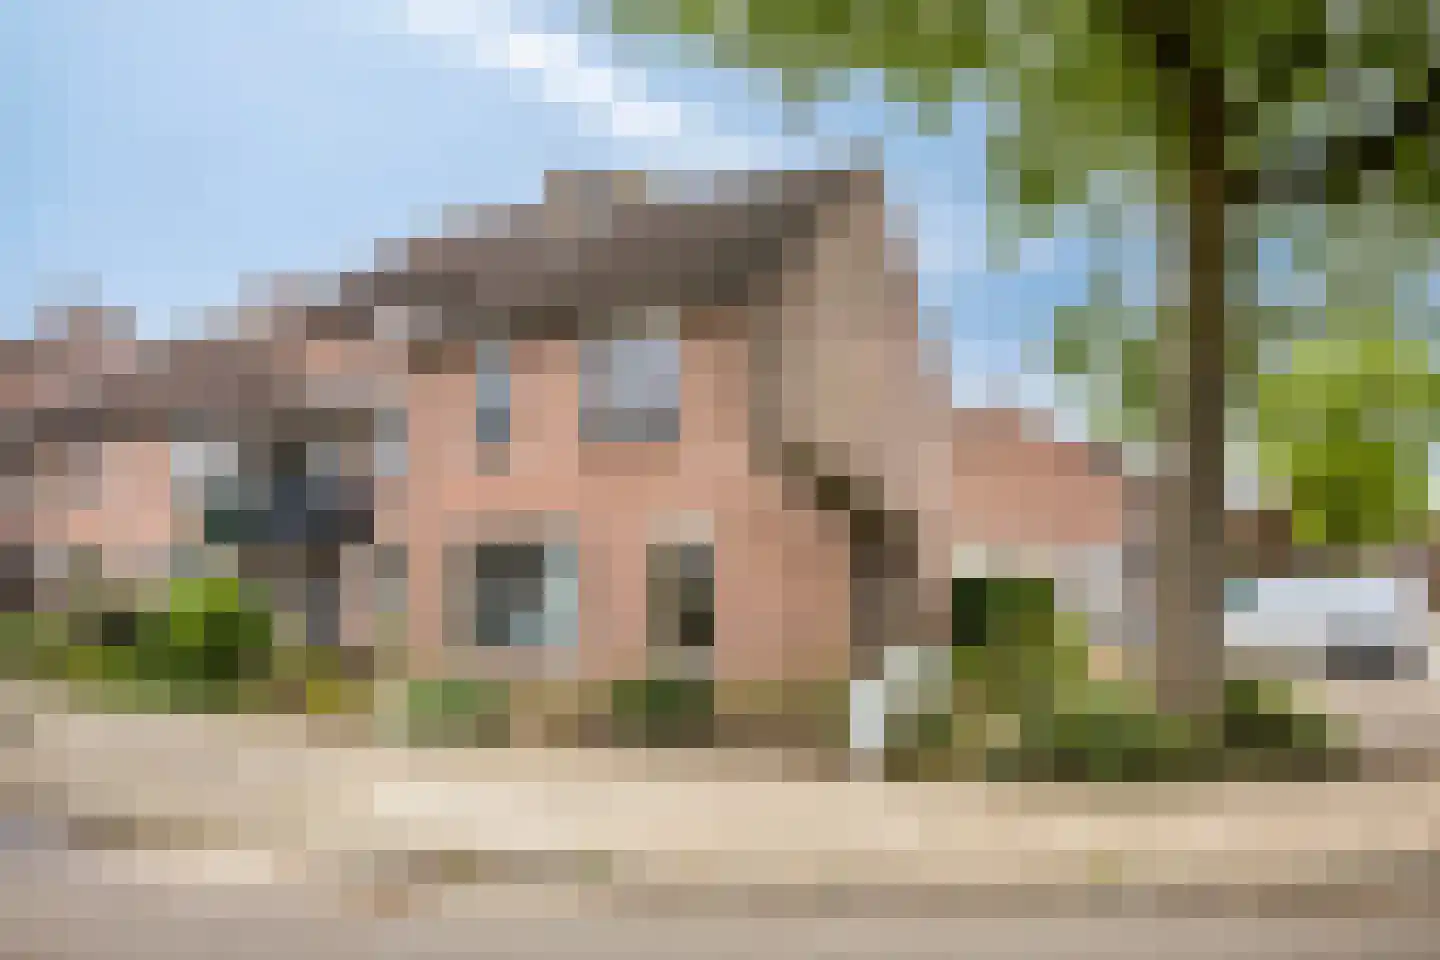
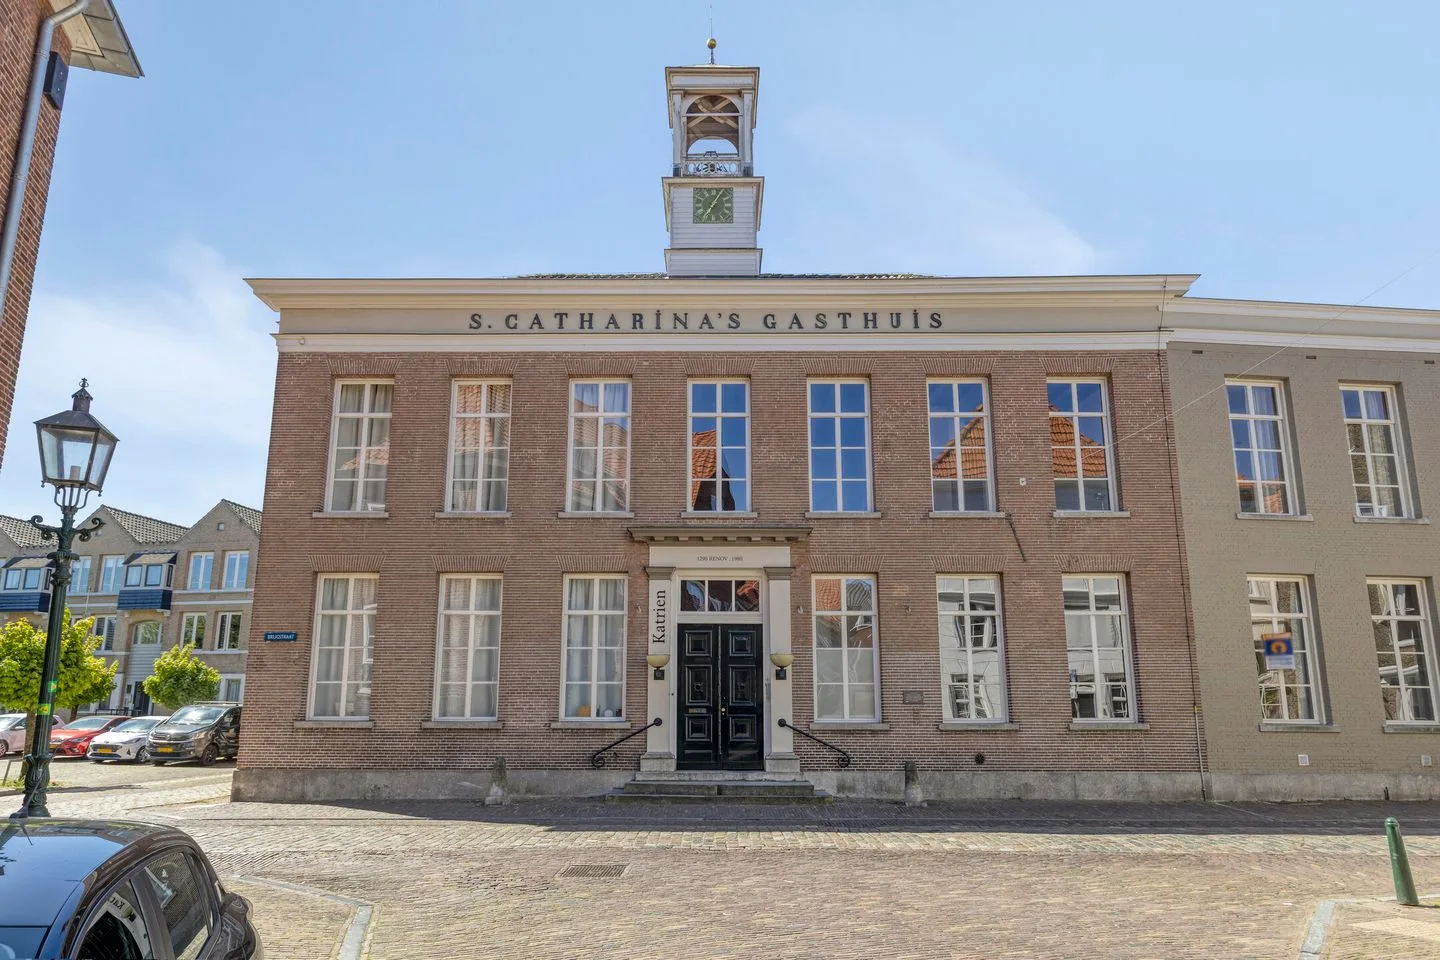
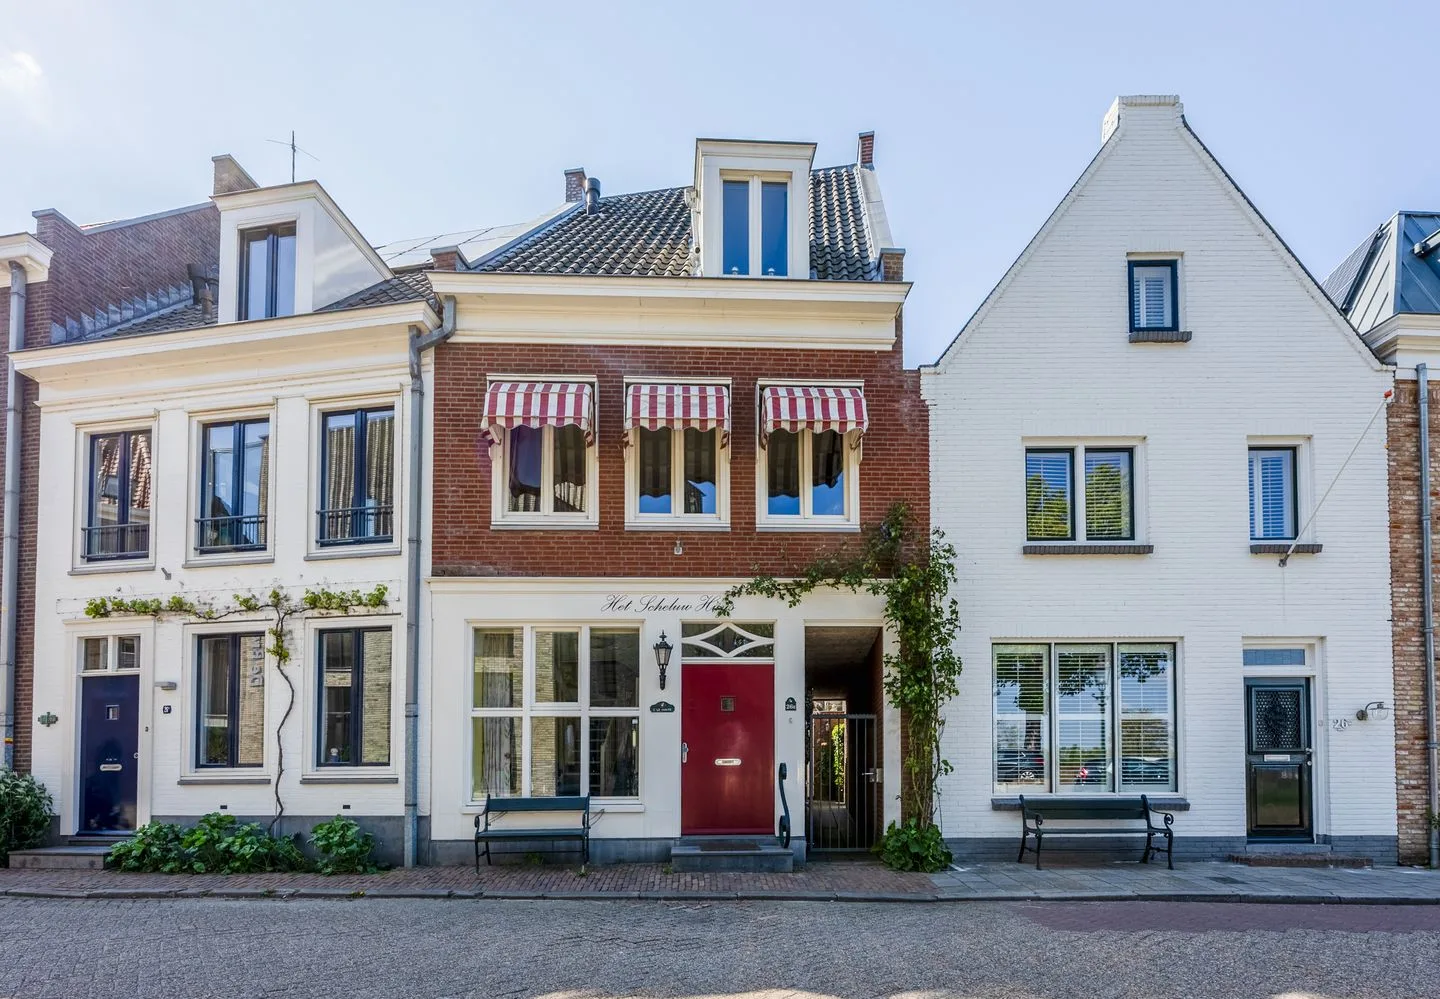
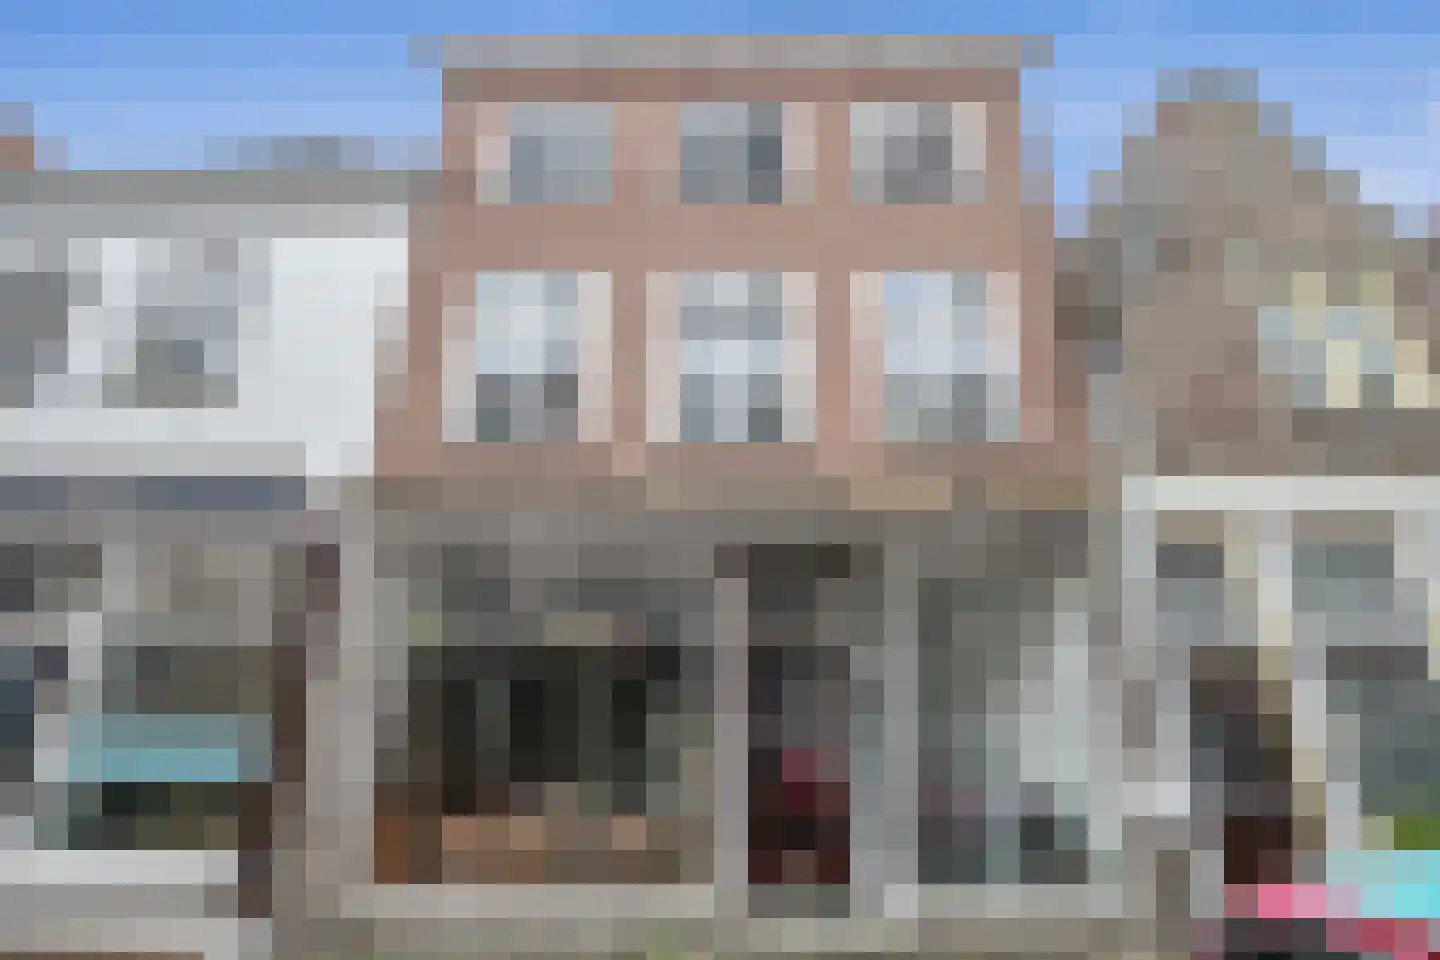
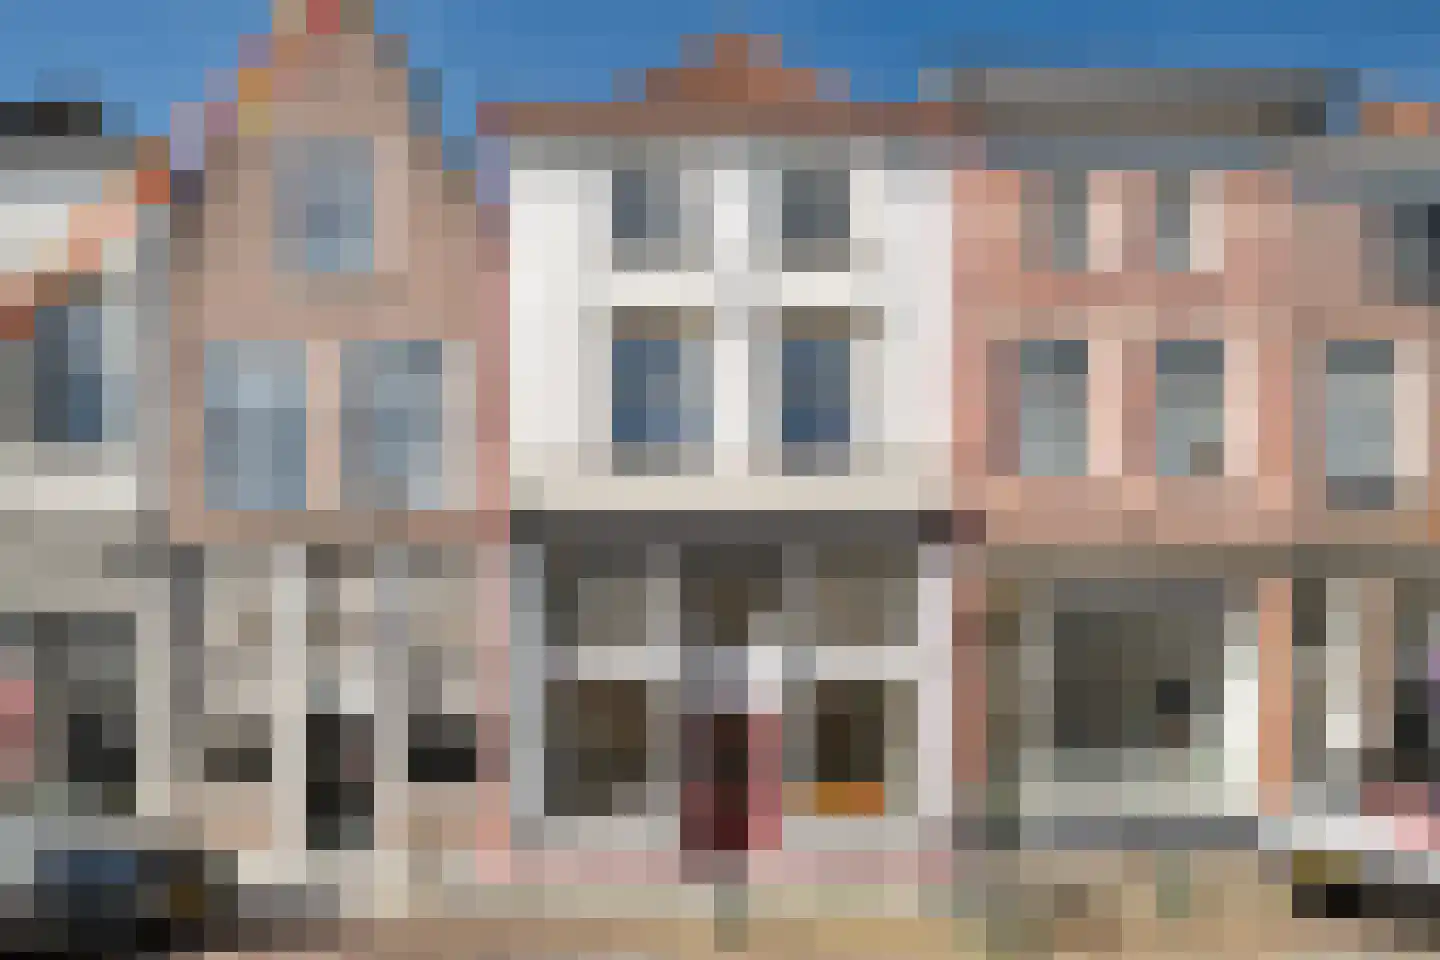
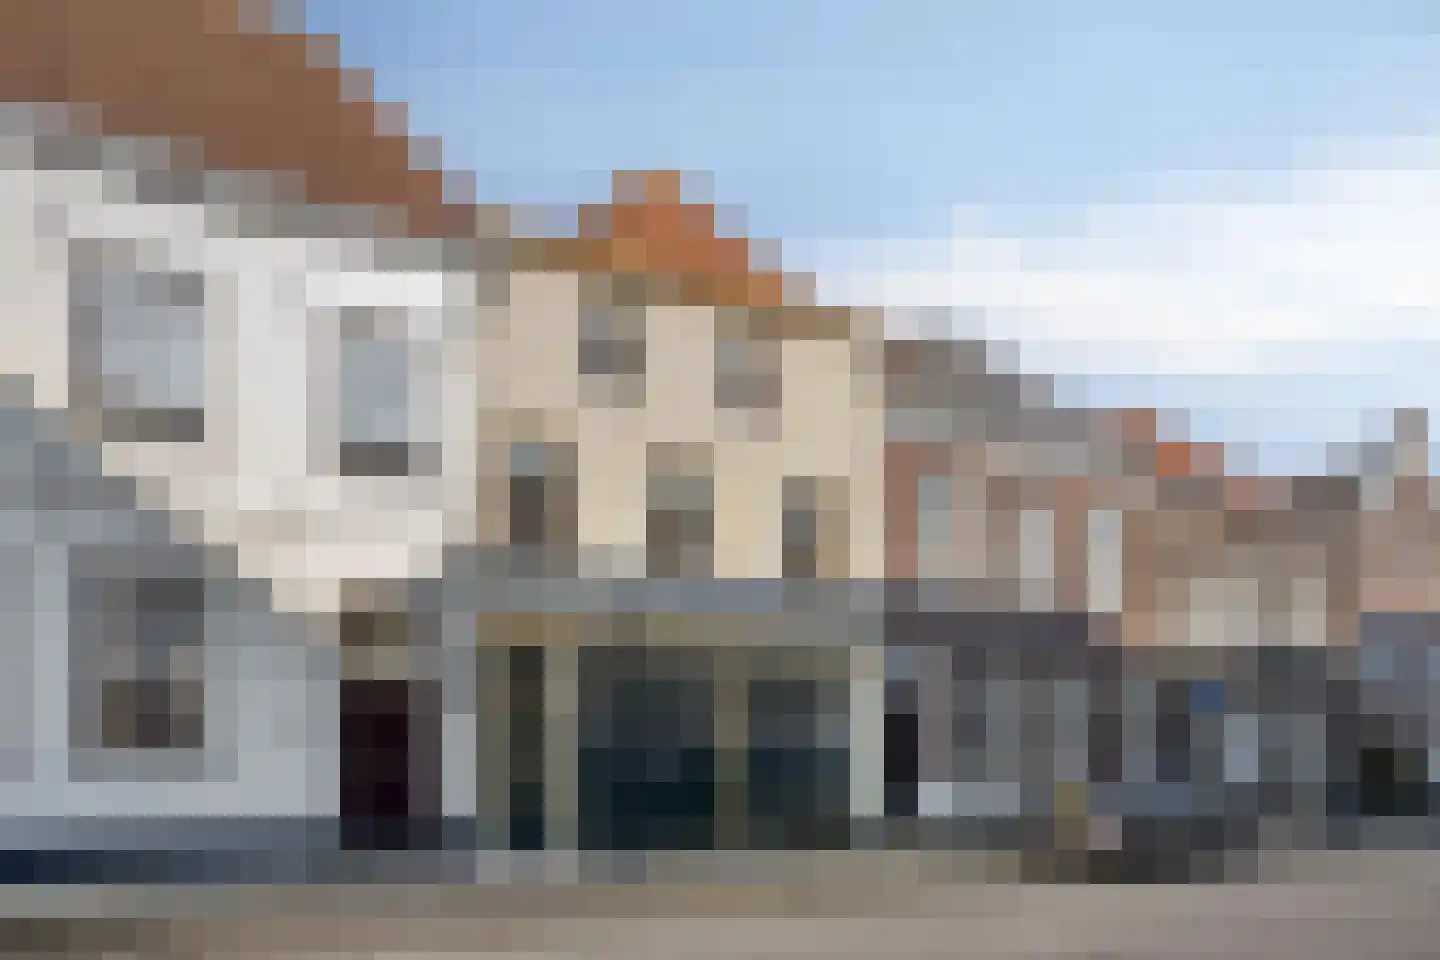
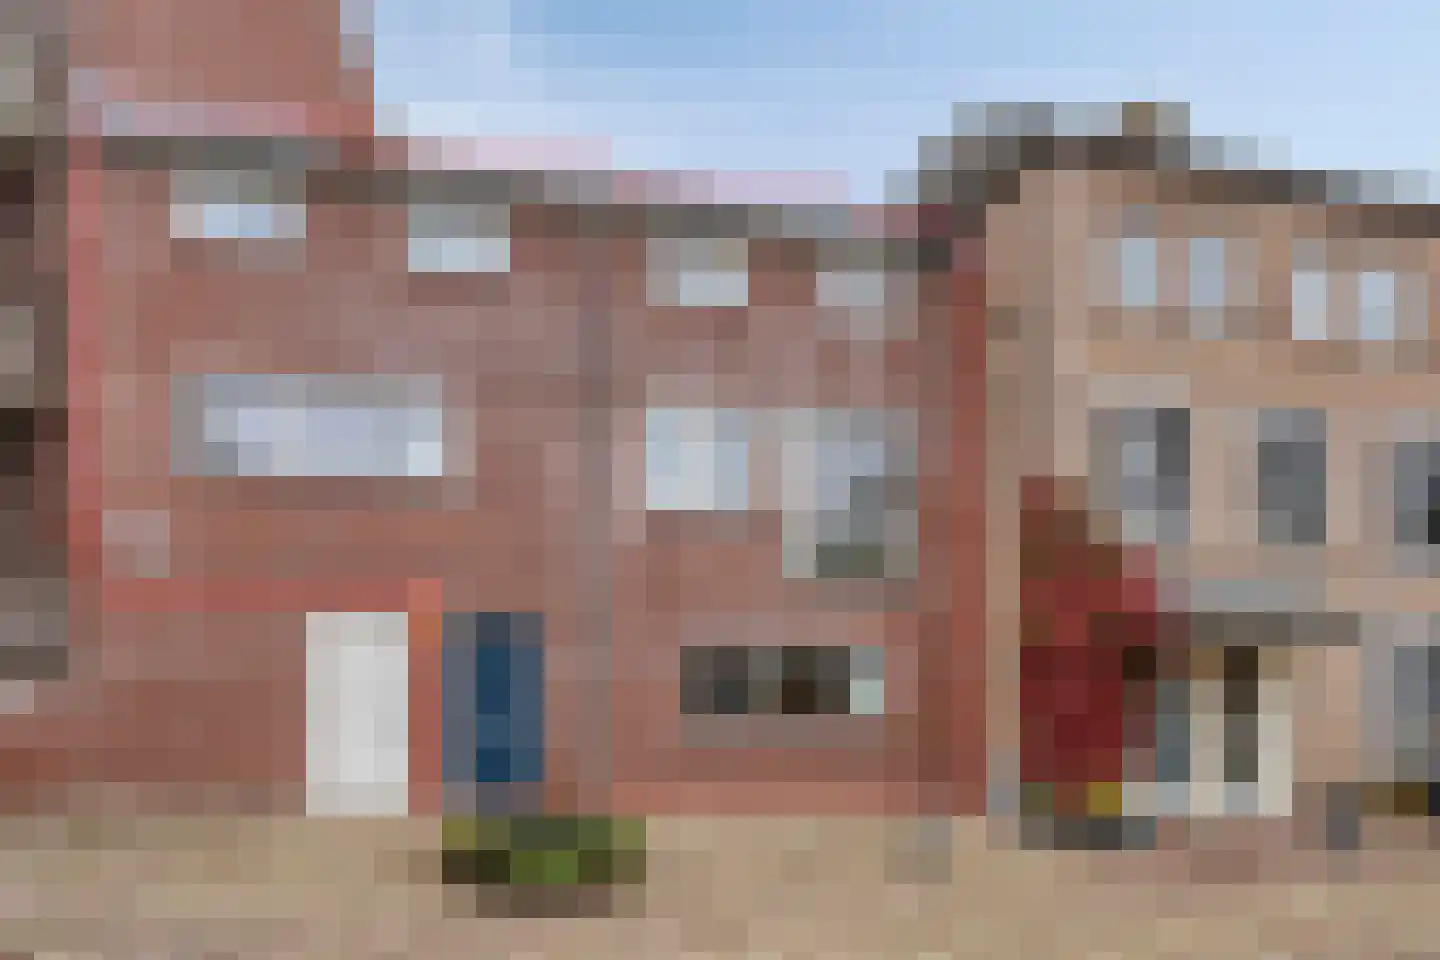
Trompetterstraat 44 a
5361ER Grave
€ 295.000 k.k.
€ 3.734/m²
- Living area
- 79 m²
- Land area
- —
- Bedrooms
- 1
Searching in 126 houses in Grave
Type to search. Use arrow down and arrow up to navigate through results and press Enter to open.
Hidden search suggestions.
View current properties in Grave or search targeted on street, postal code and property characteristics.
View the current housing stock in Grave and quickly filter by price, living area, rooms and more. There are currently 126 houses in this place within our selection. View also 84 sold houses in Grave for extra insight into the local housing market.
5361ER Grave
€ 295.000 k.k.
€ 3.734/m²
5361JV Grave
€ 389.000 k.k.
€ 3.705/m²
5361BC Grave
€ 425.000 k.k.
€ 3.427/m²
5361TE Grave
€ 400.000 k.k.
€ 3.125/m²
5361EK Grave
€ 450.000 k.k.
€ 5.056/m²
5361EL Grave
€ 359.000 k.k.
€ 4.851/m²
5361TA Grave
€ 395.000 k.k.
€ 2.992/m²
5361JE Grave
€ 375.000 k.k.
€ 3.233/m²
5361EK Grave
€ 725.000 k.k.
€ 5.410/m²
5361GT Grave
€ 560.000 k.k.
€ 5.091/m²
5361HB Grave
€ 339.000 k.k.
€ 4.346/m²
5361EN Grave
€ 375.000 k.k.
€ 2.976/m²
5361GV Grave
€ 435.000 k.k.
€ 3.321/m²
5361SB Grave
€ 545.000 k.k.
€ 3.733/m²
5361TA Grave
€ 400.000 k.k.
€ 3.053/m²
5361GN Grave
€ 515.000 k.k.
€ 4.256/m²
5361NL Grave
€ 399.000 k.k.
€ 3.470/m²
5361HA Grave
€ 450.000 k.k.
€ 1.360/m²
5361HH Grave
€ 450.000 k.k.
€ 4.839/m²
5361HA Grave
€ 639.000 k.k.
€ 3.651/m²
5361HB Grave
€ 499.000 k.k.
€ 1.721/m²
5361GR Grave
€ 498.000 k.k.
€ 2.213/m²
5361GH Grave
€ 528.000 k.k.
€ 4.552/m²
5361GN Grave
€ 500.000 k.k.
€ 3.049/m²
5361EL Grave
€ 425.000 k.k.
€ 2.545/m²
5361HB Grave
€ 699.000 k.k.
€ 2.974/m²
5361GP Grave
€ 645.000 k.k.
€ 3.000/m²
5361GT Grave
€ 365.000 k.k.
€ 2.433/m²
Get free quotes from real estate agents with local market knowledge. Compare more than 34 real estate agents in Grave.
Selling a home in Grave? Compare all real estate agents in Grave or view the top 10 real estate agents in Grave for extra context for your choice.
Real estate agents make sharper offers when they know you're comparing — ask for quotes for sale or purchase.
Practical answers about housing supply, sales and comparing real estate agents in Grave.
The costs of a real estate agent in Grave depend on commission, setup costs, property presentation and the chosen service. Compare the 34 real estate agents in Grave via the real estate agent page and request multiple quotes to compare rates and approach well.
Within our selection, we are currently showing 126 houses in Grave. View also the sold houses in Grave to compare the current offering with recent transactions.
Take into account not only price and living area but also maintenance, energy label, location, outdoor space and sales status. This way you compare houses in Grave on more than just the asking price.
A local real estate agent knows the neighborhoods, recent transactions and demand in Grave. By comparing 34 real estate agents in the region you get a better insight into prices, sales strategy and expected yield; the top 10 in Grave provides a useful starting point.
Yes, when making a sales plan, a valuation in Grave is wise. You gain insight into a realistic asking price and can then compare offers from real estate agents specifically.
View current location data on residents, WOZ development, housing stock, energy consumption, business activity and safety in Grave. In 2025 were there 8.645 residents. The average WOZ value in 2025 is EUR 339.000.
These figures help to better assess and compare the housing stock in Grave with recent sold homes. Orient yourself then on suitable top real estate agents in Grave for sales advice in this region.
Residents
8.645
Last year: 2025
Average WOZ
EUR 339.000
Last year: 2025
Average income per person.
EUR 33.400
Source: AllNumbers
Crimes (current year)
289
Total registered
| Year | Residents |
|---|---|
| 2021 | 8.580 |
| 2022 | 8.550 |
| 2023 | 8.620 |
| 2024 | 8.575 |
| 2025 | 8.645 |
| Year | Average WOZ |
|---|---|
| 2021 | EUR 226.000 |
| 2022 | EUR 251.000 |
| 2023 | EUR 291.000 |
| 2024 | EUR 320.000 |
| 2025 | EUR 339.000 |
Hoger
1.720
Praktisch
1.680
Middelbaar
2.970
Europa
640
Nederland
7.140
Buiten Europa
865
Label C
1.393
Label B
814
Label A
786
Label D
398
Label E
211
Label F
196
Label G
132
Label A+++
94
Label A++
78
Label A+
48
Label A++++
5
Label A+++++
0
| Year | Gas (m3) | Electricity (kWh) |
|---|---|---|
| 2020 | 1.170 | 2.780 |
| 2021 | 1.340 | 2.790 |
| 2022 | 1.050 | 2.600 |
| 2023 | 870 | 2.450 |
| 2024 | 850 | 2.480 |
Hoekwoning
Gas: 960 • Electricity: 2.590
Huurwoning
Gas: 720 • Electricity: 1.910
Koopwoning
Gas: 950 • Electricity: 2.720
Appartement
Gas: 590 • Electricity: 1.820
Tussenwoning
Gas: 880 • Electricity: 2.460
Vrijstaande woning
Gas: 1.360 • Electricity: 3.750
Twee-onder-één-kap woning
Gas: 980 • Electricity: 2.730
Total number of company establishments: 900
| Period | Crimes |
|---|---|
| jan 2025 | 29 |
| jan 2026 | 16 |
| jul 2025 | 21 |
| jun 2025 | 15 |
| mei 2025 | 27 |
| mrt 2025 | 23 |
| nov 2024 | 20 |
| nov 2025 | 20 |
| okt 2024 | 32 |
| okt 2025 | 31 |
| sep 2024 | 48 |
| sep 2025 | 26 |
These figures give an indicative picture of safety trends in the living environment of Grave.
Short answers based on current local statistics, handy for a quick comparison of the living environment.
Grave telt in 2025 ongeveer 8.645 inwoners.
De gemiddelde WOZ-waarde in Grave is in 2025 circa € 339.000.
Het gemiddelde inkomen per inwoner in Grave ligt rond € 33.400 per jaar.
Voor het huidige jaar gaat het om ongeveer 289 geregistreerde misdrijven. Gebruik deze cijfers als indicatie en vergelijk trends per periode.
In Grave komt vooral "Tussenwoningen" veel voor, met ongeveer 1.742 woningen.