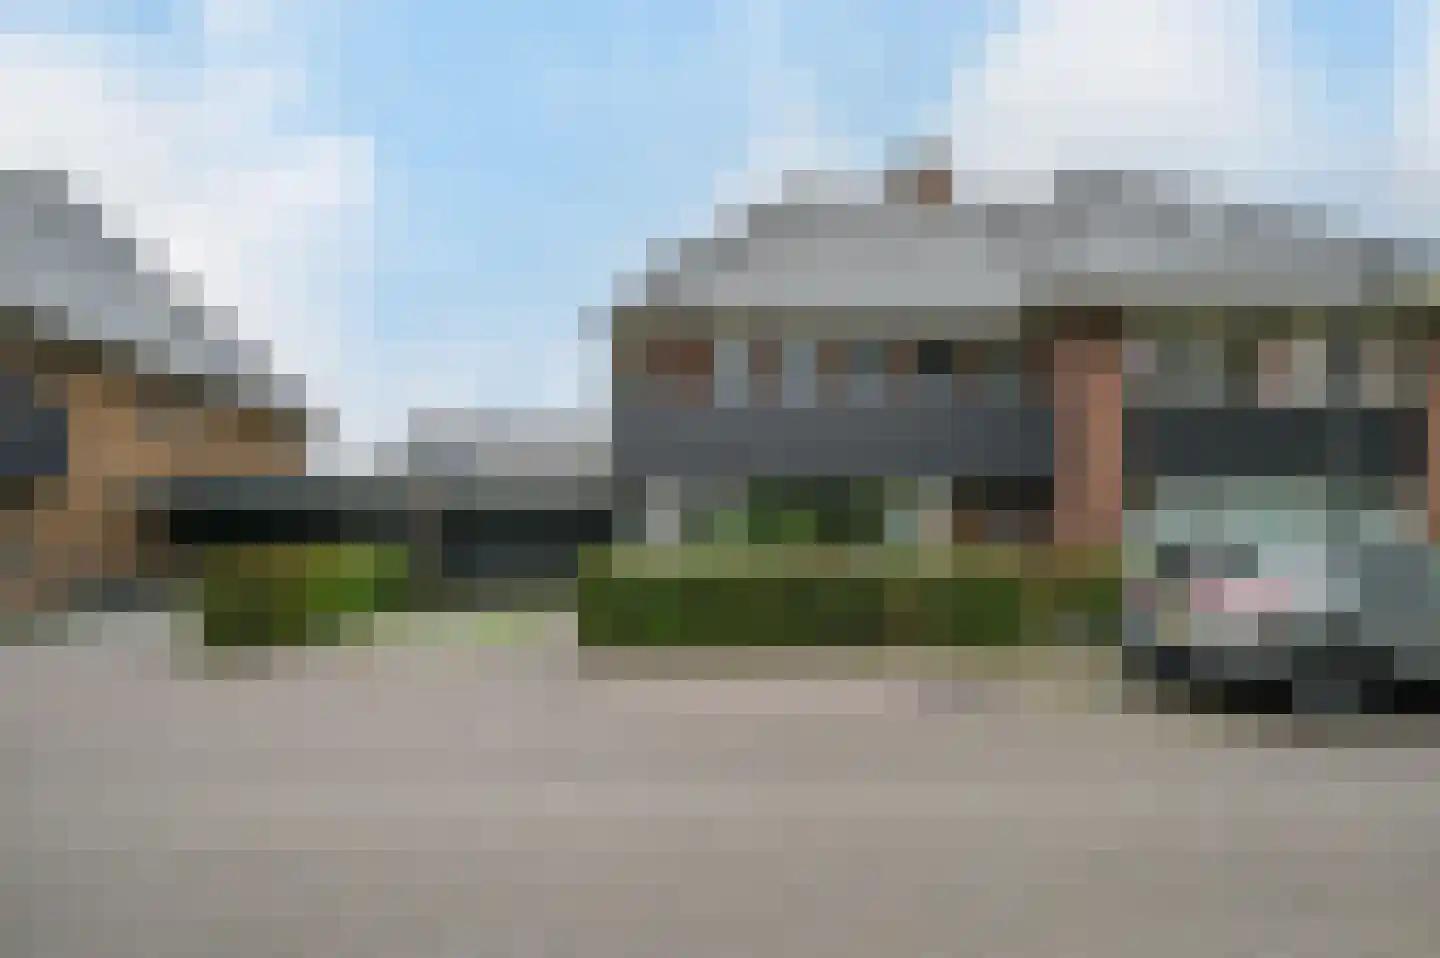
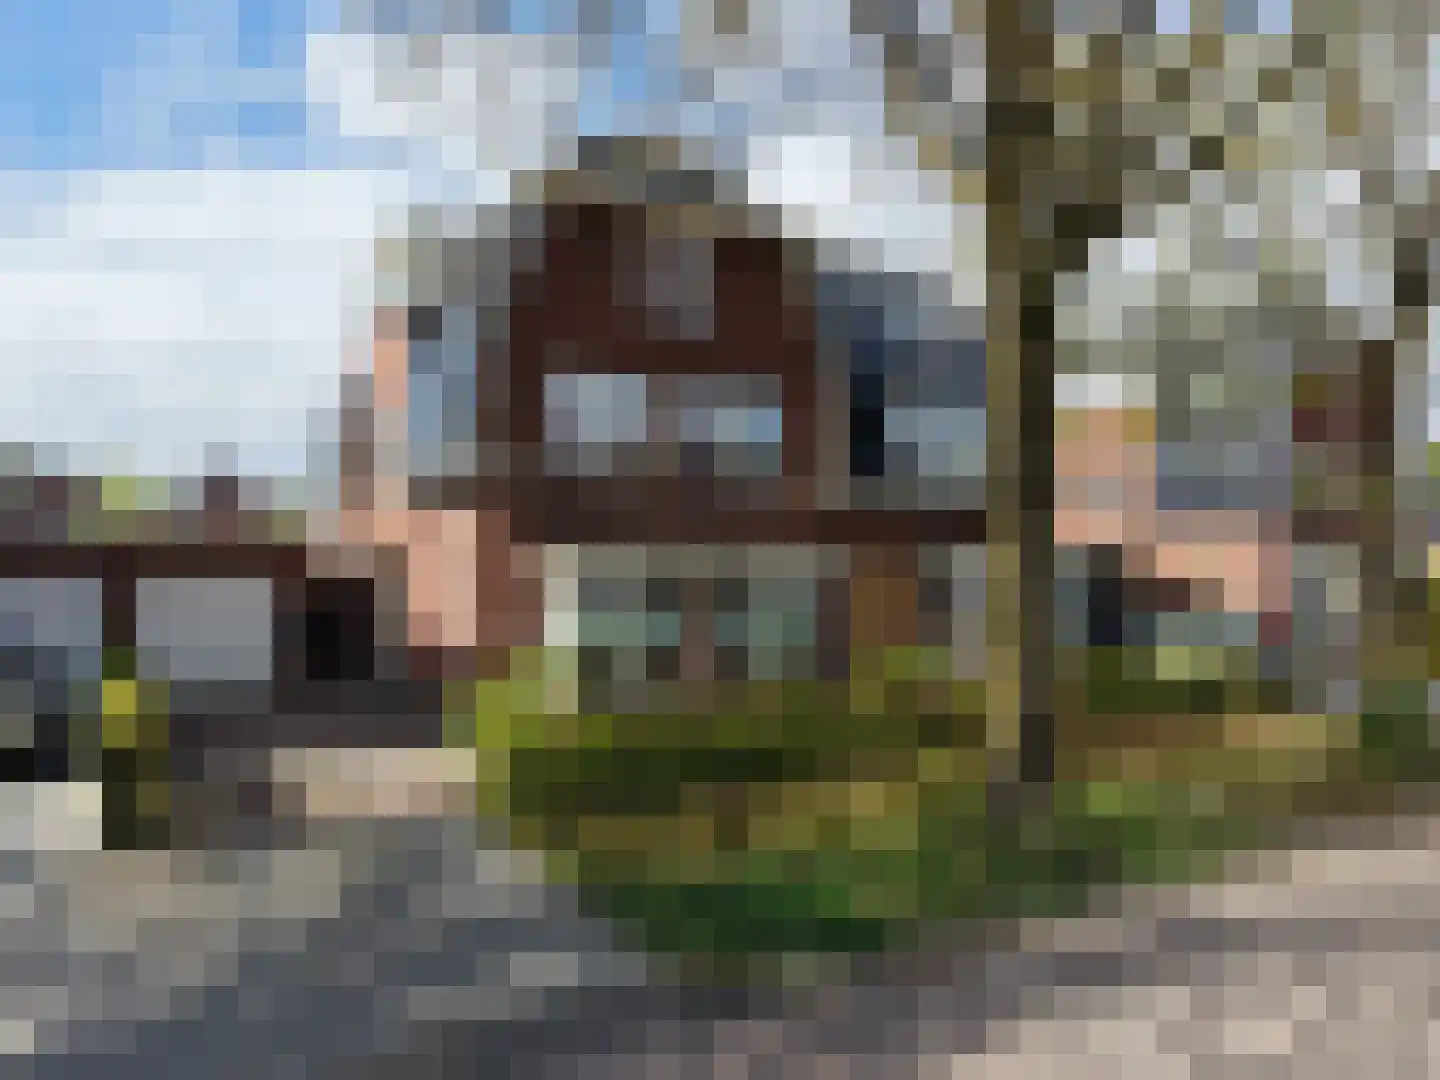
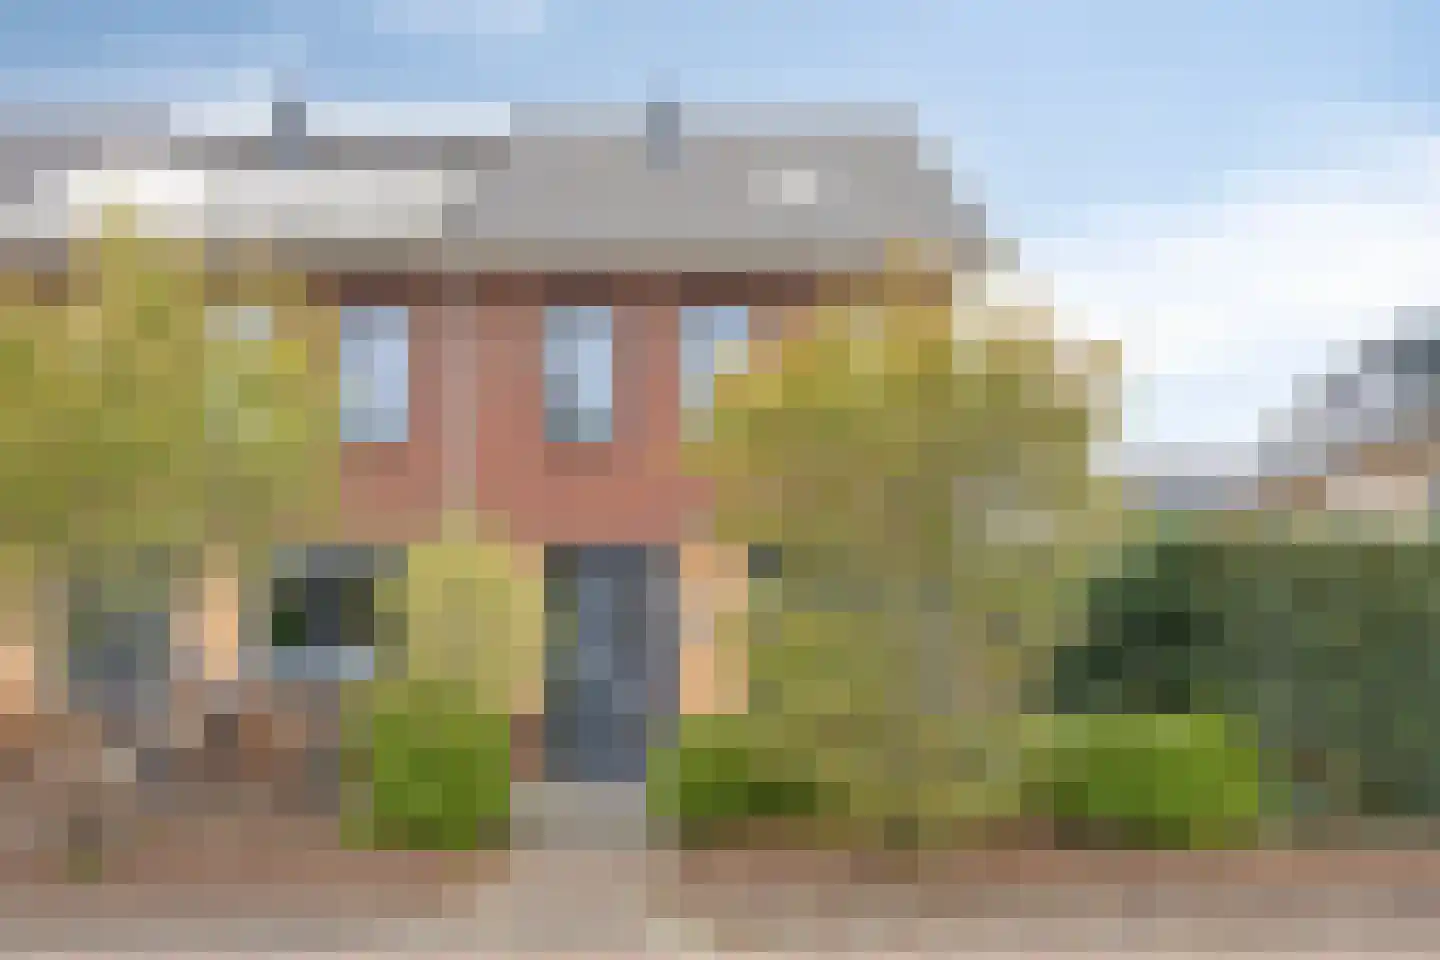
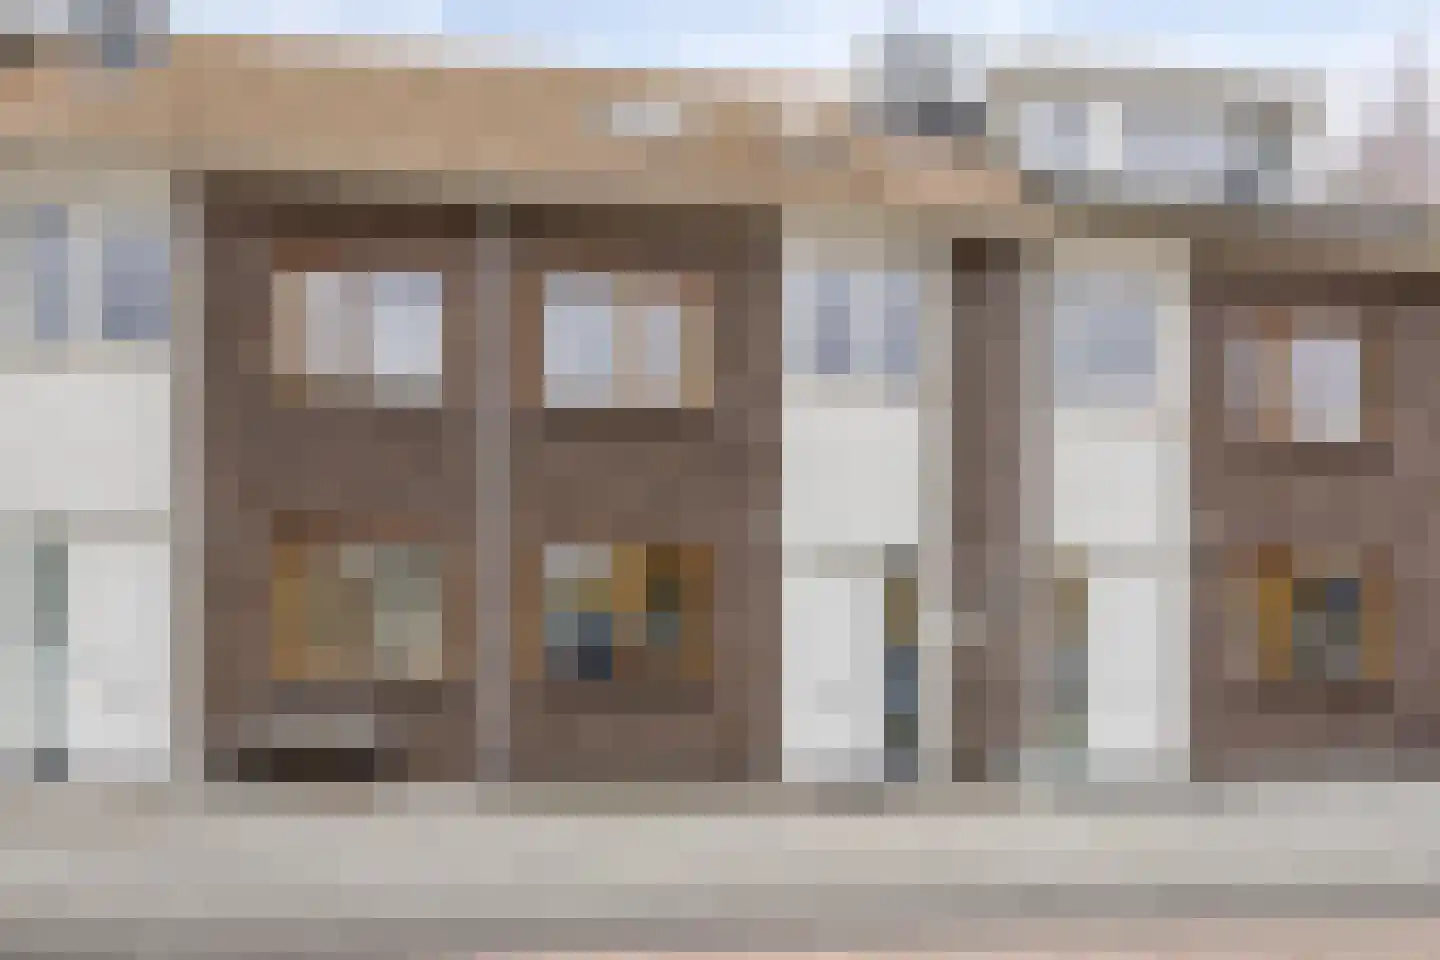
Housing offer in Hooglanderveen

Searching in 59 houses in Hooglanderveen

Connected to: Vastgoed Nederland NVM Makelaars

View the current housing stock in Hooglanderveen and quickly filter by price, living area, rooms and more. There are currently 59 houses in this place within our selection. View also 48 sold houses in Hooglanderveen for extra insight into the local housing market.

Selection

Search and filter homes

Set your preferences and discover homes that suit you.

Total supply 242.655
Filters

Set price, area and other characteristics. Adjust a filter or click on Show homes. Location changes directly above.

Reset filters

You search for

  • Place Hooglanderveen

Selling a home in Hooglanderveen? Compare realtor offers

Get free quotes from real estate agents with local market knowledge. Compare more than 93 real estate agents in Hooglanderveen.

Free request a quote

  • Quotes in Hooglanderveen
  • Non-binding
  • Personal
  • Compare free rates

Selling a home in Hooglanderveen? Compare all real estate agents in Hooglanderveen or view the top 10 real estate agents in Hooglanderveen for extra context for your choice.

Compare multiple quotes

Real estate agents make sharper offers when they know you're comparing — ask for quotes for sale or purchase.

Frequently asked questions about homes in Hooglanderveen

Practical answers about housing supply, sales and comparing real estate agents in Hooglanderveen.

Residential and neighborhood statistics in Hooglanderveen

View current location data on residents, WOZ development, housing stock, energy consumption, business activity and safety in Hooglanderveen. In 2025 were there 4.835 residents. The average WOZ value in 2025 is EUR 585.000.

These figures help to better assess and compare the housing stock in Hooglanderveen with recent sold homes. Orient yourself then on suitable top real estate agents in Hooglanderveen for sales advice in this region.

Residents

4.835

Last year: 2025

Average WOZ

EUR 585.000

Last year: 2025

Average income per person.

EUR 40.600

Source: AllNumbers

Crimes (current year)

83

Total registered

Demographics and WOZ development

Inhabitants per year

Inhabitants per year in Hooglanderveen
Year Residents
2021 4.935
2022 4.910
2023 4.875
2024 4.870
2025 4.835

Annual WOZ value

WOZ value per year in Hooglanderveen
Year Average WOZ
2021 EUR 419.000
2022 EUR 463.000
2023 EUR 543.000
2024 EUR 546.000
2025 EUR 585.000

Composition of residents

Age build-up

65+: 555 0-15: 1.030 15-25: 680 25-45: 1.130 45-65: 1.430

Education level

Hoger

1.590

Praktisch

580

Middelbaar

1.340

Origin of residents (2025)

Europa

230

Nederland

3.910

Buiten Europa

695

Housing stock and construction periods

Types of homes

Hoekwoningen 340
Appartementen 251
Tussenwoningen 622
Vrijstaande woningen 267
Twee-onder-één-kap woningen 285

Construction period of buildings

Voor 1700 0
1700 tot 1900 3
1900 tot 1925 20
1925 tot 1950 26
1950 tot 1970 271
1970 tot 1980 43
1980 tot 1990 153
1990 tot 2000 113
2000 tot 2010 681
2010 tot 2020 299
2020 en later 15

Energy and sustainability

Energy label distribution

Label A

1.067

Label C

253

Label B

233

Label D

67

Label E

54

Label F

44

Label A+

35

Label G

30

Label A+++

11

Label A++

6

Label A++++

0

Label A+++++

0

Average energy consumption per year

Average energy consumption per year in Hooglanderveen
Year Gas (m3) Electricity (kWh)
2020 1.150 3.290
2021 1.300 3.430
2022 1.030 3.230
2023 880 3.040
2024 860 3.180

Consumption per house type

Hoekwoning

Gas: 920 • Electricity: 3.040

Huurwoning

Gas: 700 • Electricity: 1.910

Koopwoning

Gas: 940 • Electricity: 3.380

Appartement

Gas: 620 • Electricity: 1.690

Tussenwoning

Gas: 770 • Electricity: 2.650

Vrijstaande woning

Gas: 1.220 • Electricity: 4.690

Twee-onder-één-kap woning

Gas: 1.000 • Electricity: 3.640

Business activity in Hooglanderveen (2025)

Handel en HORECA 75
Nijverheid en energie 50
Zakelijke dienstverlening 195
Overheid, onderwijs en zorg 115
Landbouw, bosbouw en visserij 0
Vervoer, informatie en communicatie 55
Financiele diensten en onroerendgoed 35
Cultuur, recreatie en overige diensten 55

Total number of company establishments: 585

Recent crime statistics

Recent crime statistics in Hooglanderveen
Period Crimes
jan 2026 6
jul 2025 8
jun 2025 11
mei 2025 8
mrt 2025 12
mrt 2026 4
nov 2024 9
nov 2025 3
okt 2024 7
okt 2025 6
sep 2024 16
sep 2025 6

These figures give an indicative picture of safety trends in the living environment of Hooglanderveen.

Frequently asked questions about living in Hooglanderveen

Short answers based on current local statistics, handy for a quick comparison of the living environment.

Hoeveel inwoners heeft Hooglanderveen?

Hooglanderveen telt in 2025 ongeveer 4.835 inwoners.

Wat is de gemiddelde WOZ-waarde in Hooglanderveen?

De gemiddelde WOZ-waarde in Hooglanderveen is in 2025 circa € 585.000.

Wat is het gemiddelde inkomen per inwoner in Hooglanderveen?

Het gemiddelde inkomen per inwoner in Hooglanderveen ligt rond € 40.600 per jaar.

Hoe veilig is wonen in Hooglanderveen?

Voor het huidige jaar gaat het om ongeveer 83 geregistreerde misdrijven. Gebruik deze cijfers als indicatie en vergelijk trends per periode.

Welke woningtypen komen het meest voor in Hooglanderveen?

In Hooglanderveen komt vooral "Tussenwoningen" veel voor, met ongeveer 622 woningen.

Receive free, non-binding quotes

Compare multiple real estate agents and choose the best match.