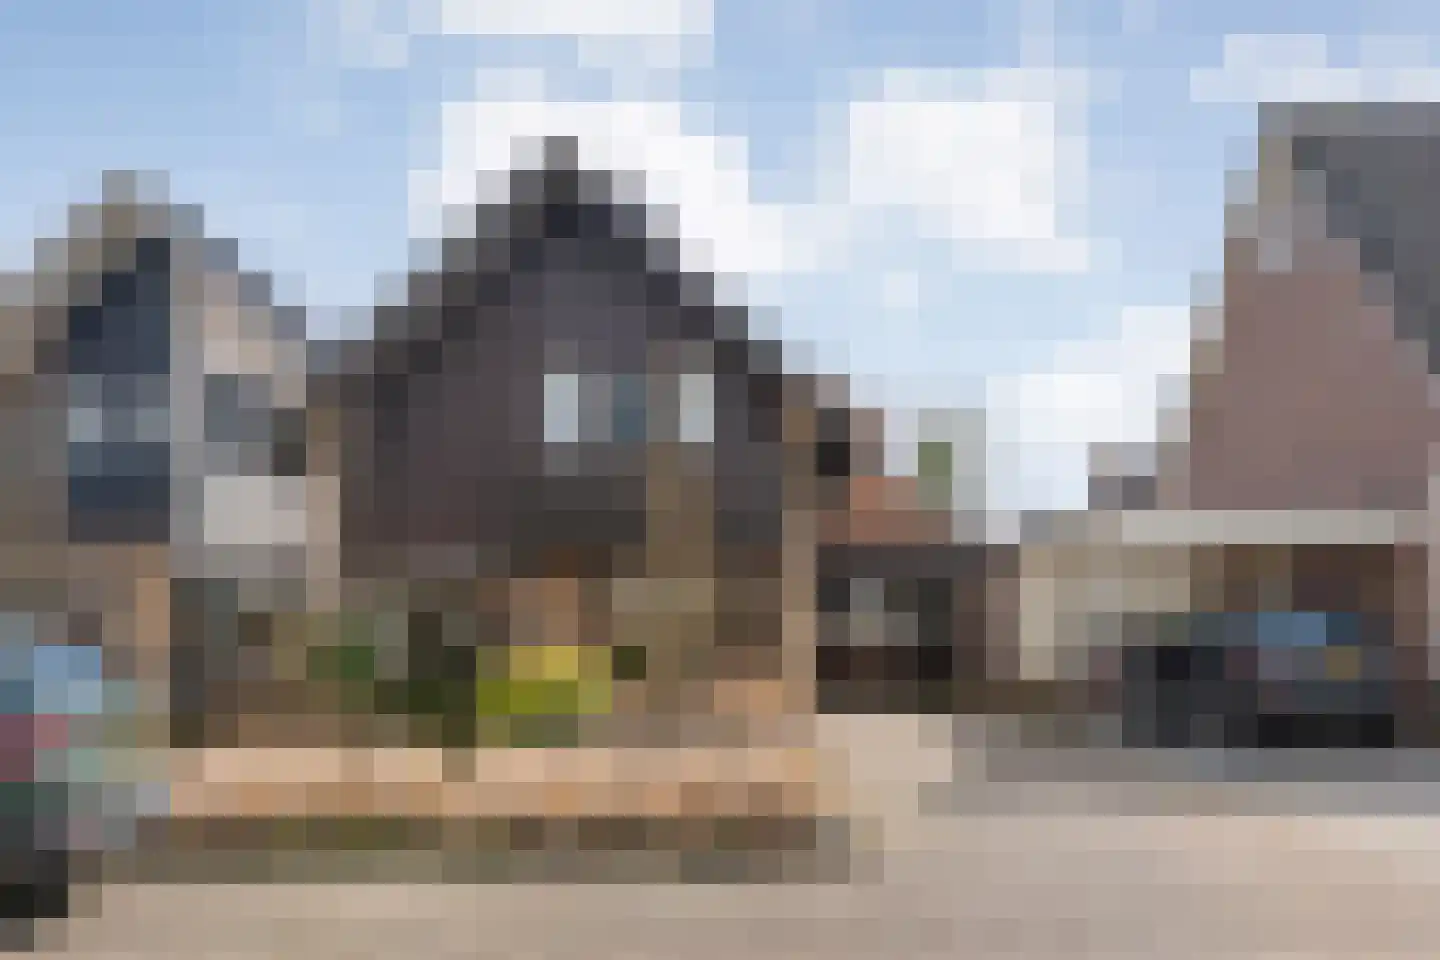
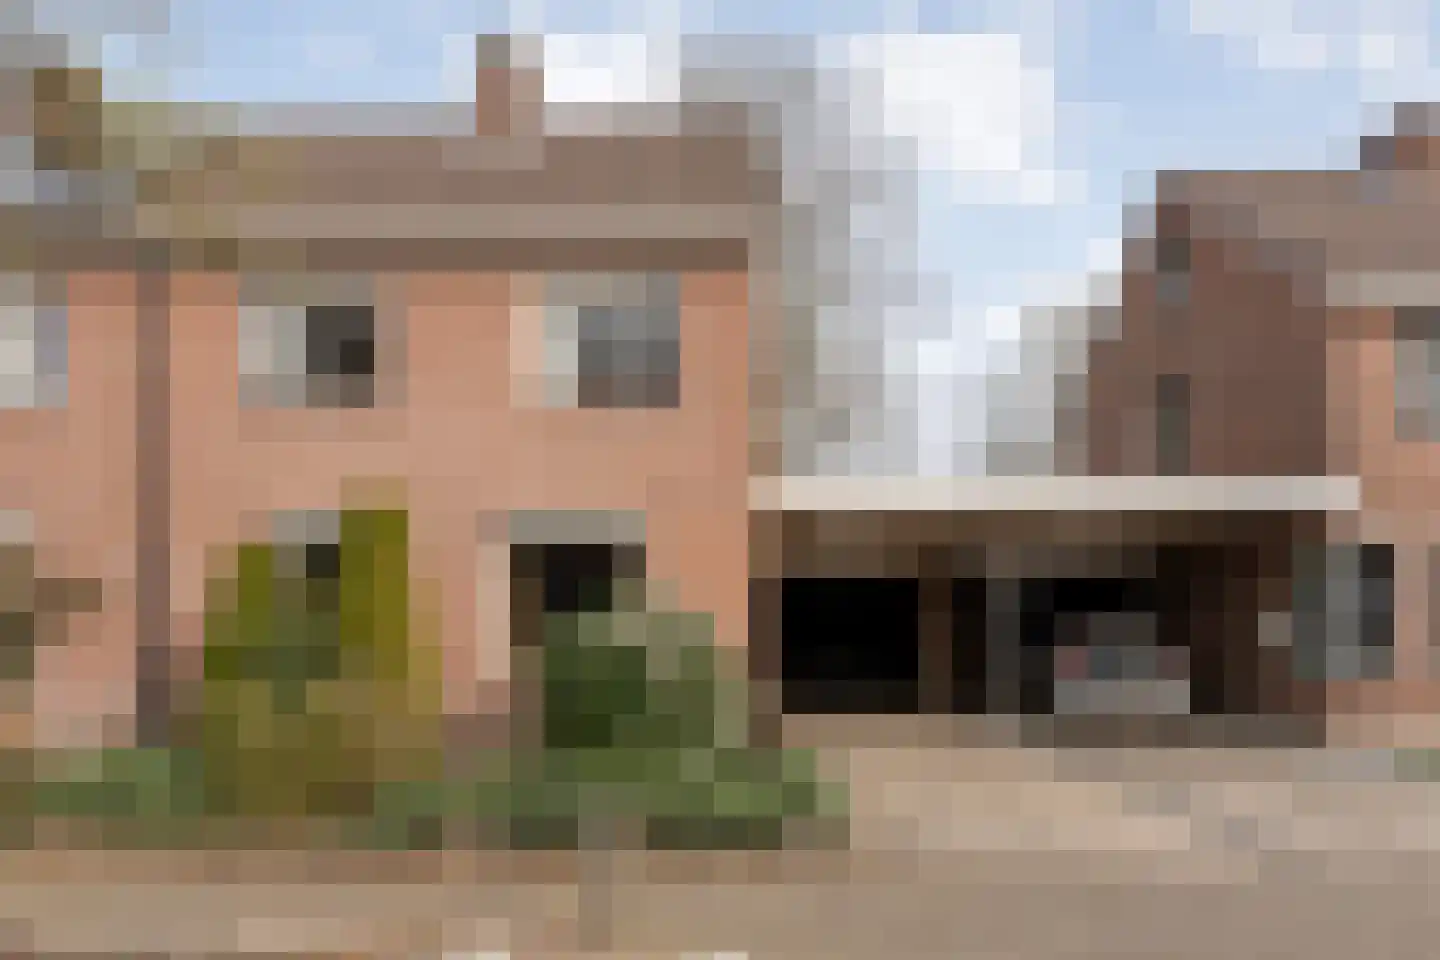
- Available
Almeloseweg 1
7651NC Tubbergen
€ 485.000
€ 5.774/m²
- Living area
- 84 m²
- Land area
- —
- Bedrooms
- 2
Found: 65 houses in Tubbergen within your selection
Type to search. Use arrow down and arrow up to navigate through results and press Enter to open.
Hidden search suggestions.
Refine your selection in Tubbergen or reset the filters for the full housing stock.
View the current housing stock in Tubbergen and quickly filter by price, living area, rooms and more. There are currently 65 houses in this place within our selection. View also 47 sold houses in Tubbergen for extra insight into the local housing market.
7651NC Tubbergen
€ 485.000
€ 5.774/m²
7651EH Tubbergen
€ 639.000 k.k.
€ 2.766/m²
7651GA Tubbergen
€ 415.000 k.k.
€ 3.029/m²
7651BP Tubbergen
€ 469.000 k.k.
€ 3.693/m²
7651EB Tubbergen
€ 745.000 k.k.
7651DA Tubbergen
€ 745.000 k.k.
7651AS Tubbergen
€ 389.000 k.k.
€ 4.228/m²
7651GK Tubbergen
€ 389.000 k.k.
€ 2.903/m²
7651CR Tubbergen
€ 489.000 k.k.
€ 3.677/m²
7651BP Tubbergen
€ 595.000 k.k.
€ 3.742/m²
7651EP Tubbergen
€ 449.000 k.k.
€ 3.973/m²
7651EE Tubbergen
€ 449.000 k.k.
€ 2.551/m²
7651CJ Tubbergen
€ 598.000 k.k.
€ 3.232/m²
7651EJ Tubbergen
€ 1.195.000 k.k.
€ 3.515/m²
7651AD Tubbergen
€ 520.000 k.k.
€ 3.421/m²
7651GP Tubbergen
€ 1.075.000 k.k.
€ 4.594/m²
7651JR Tubbergen
€ 897.000 k.k.
€ 4.553/m²
7651GT Tubbergen
€ 565.000 k.k.
€ 3.466/m²
7651CZ Tubbergen
€ 335.000 k.k.
€ 4.187/m²
7651JK Tubbergen
€ 685.000 k.k.
€ 3.914/m²
7651HA Tubbergen
€ 730.000 k.k.
€ 4.294/m²
7651CZ Tubbergen
€ 315.000 k.k.
€ 3.987/m²
7651BE Tubbergen
€ 350.000 k.k.
€ 3.398/m²
7651CZ Tubbergen
€ 295.000 k.k.
€ 3.734/m²
7651HD Tubbergen
€ 856.000 k.k.
€ 3.090/m²
7651CT Tubbergen
€ 439.000 k.k.
€ 3.091/m²
7651AN Tubbergen
€ 389.000 k.k.
€ 3.241/m²
7651GJ Tubbergen
€ 389.000 k.k.
€ 3.704/m²
Get free quotes from realtors with local market knowledge in Tubbergen.
Selling a home in Tubbergen? Compare real estate agents who know the local housing market. Also check out all real estate agents in Tubbergen or the top 10 real estate agents in Tubbergen for extra context for your choice.
By comparing brokers and requesting quotes
Practical answers about housing supply, sales and comparing real estate agents in Tubbergen.
The costs of a real estate agent in Tubbergen depend on commission, start-up costs, property presentation and the chosen service. View the real estate agents in Tubbergen and request multiple quotes to compare rates and approach properly.
Within our selection, we are currently showing 65 houses in Tubbergen. View also the sold houses in Tubbergen to compare the current offering with recent transactions.
Let naast prijs en woonoppervlakte ook op onderhoud, energielabel, ligging, buitenruimte en de verkoopstatus. Zo vergelijk je woningen in Tubbergen op meer dan alleen de vraagprijs.
A local real estate agent knows the neighborhoods, recent transactions and demand in Tubbergen. By comparing agents you get a better insight into fees, sales strategy and expected yield; the top 10 in Tubbergen gives a handy starting point.
Yes, when making a sales plan, a valuation in Tubbergen is wise. You gain insight into a realistic asking price and can then compare offers from real estate agents specifically.
View current location data on residents, WOZ development, housing stock, energy consumption, business activity and safety in Tubbergen. In 2025 were there 5.900 residents. The average WOZ value in 2025 is EUR 391.000.
These figures help to better assess and compare the housing stock in Tubbergen with recent sold homes. Orient yourself then on suitable top real estate agents in Tubbergen for sales advice in this region.
Residents
5.900
Last year: 2025
Average WOZ
EUR 391.000
Last year: 2025
Average income per person.
EUR 32.600
Source: AllNumbers
Crimes (current year)
97
Total registered
| Year | Residents |
|---|---|
| 2021 | 5.768 |
| 2022 | 5.778 |
| 2023 | 5.850 |
| 2024 | 5.860 |
| 2025 | 5.900 |
| Year | Average WOZ |
|---|---|
| 2021 | EUR 293.000 |
| 2022 | EUR 331.000 |
| 2023 | EUR 372.000 |
| 2024 | EUR 383.000 |
| 2025 | EUR 391.000 |
Hoger
1.230
Praktisch
1.090
Middelbaar
1.980
Europa
260
Nederland
5.345
Buiten Europa
295
Label A
814
Label C
605
Label B
434
Label D
216
Label A+++
135
Label F
115
Label G
88
Label A++
62
Label A+
60
Label E
57
Label A++++
46
Label A+++++
0
| Year | Gas (m3) | Electricity (kWh) |
|---|---|---|
| 2020 | 1.400 | 3.220 |
| 2021 | 1.640 | 3.280 |
| 2022 | 1.290 | 3.000 |
| 2023 | 1.050 | 2.960 |
| 2024 | 960 | 3.050 |
Hoekwoning
Gas: 970 • Electricity: 2.740
Huurwoning
Gas: 780 • Electricity: 2.060
Koopwoning
Gas: 1.210 • Electricity: 3.460
Appartement
Gas: 730 • Electricity: 1.990
Tussenwoning
Gas: 900 • Electricity: 2.500
Vrijstaande woning
Gas: 1.380 • Electricity: 3.970
Twee-onder-één-kap woning
Gas: 1.120 • Electricity: 3.080
Total number of company establishments: 685
| Period | Crimes |
|---|---|
| jan 2025 | 6 |
| jan 2026 | 6 |
| jul 2025 | 8 |
| jun 2025 | 4 |
| mei 2025 | 9 |
| mrt 2025 | 12 |
| nov 2024 | 13 |
| nov 2025 | 7 |
| okt 2024 | 6 |
| okt 2025 | 11 |
| sep 2024 | 21 |
| sep 2025 | 7 |
These figures give an indicative picture of safety trends in the living environment of Tubbergen.
Short answers based on current local statistics, handy for a quick comparison of the living environment.
Tubbergen telt in 2025 ongeveer 5.900 inwoners.
De gemiddelde WOZ-waarde in Tubbergen is in 2025 circa € 391.000.
Het gemiddelde inkomen per inwoner in Tubbergen ligt rond € 32.600 per jaar.
Voor het huidige jaar gaat het om ongeveer 97 geregistreerde misdrijven. Gebruik deze cijfers als indicatie en vergelijk trends per periode.
In Tubbergen komt vooral "Vrijstaande woningen" veel voor, met ongeveer 776 woningen.