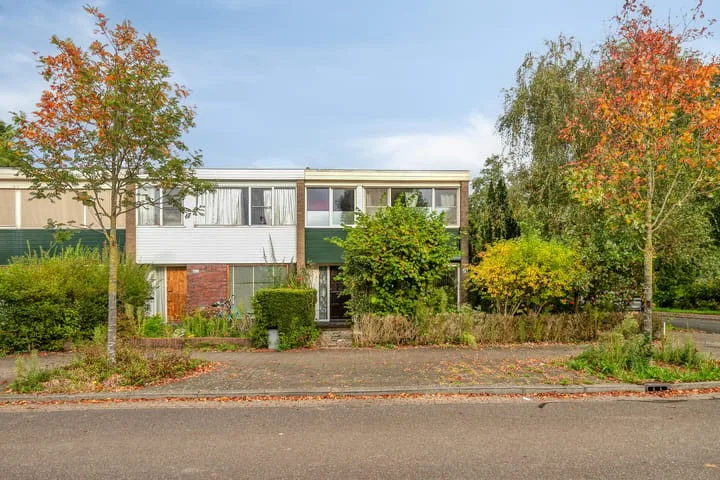
- Sold
Oltmansstraat 2
3532GS Utrecht
€ 675.000 k.k.
€ 6.081/m²
- Living area
- 111 m²
- Land area
- 83 m²
- Bedrooms
- 3
View 3.879 sold houses in Utrecht
Type to search. Use arrow down and arrow up to navigate through results and press Enter to open.
Hidden search suggestions.
Compare sold homes in Utrecht or view the current offering in this location directly.
On this page you will find recently sold homes in Utrecht. Use this overview to better estimate selling prices, popular neighborhoods, and the local housing supply before you choose a real estate agent. Also view the current housing supply with 5.107 houses in Utrecht.
3532GS Utrecht
€ 675.000 k.k.
€ 6.081/m²
3581LM Utrecht
€ 550.000 k.k.
€ 7.638/m²
3584HD Utrecht
€ 485.000 k.k.
€ 6.381/m²
3514TL Utrecht
€ 450.000 k.k.
€ 7.258/m²
3532GD Utrecht
€ 489.000 k.k.
€ 7.761/m²
3511RR Utrecht
€ 325.000 k.k.
€ 6.770/m²
3562AZ Utrecht
€ 295.000 k.k.
€ 4.402/m²
3525VP Utrecht
€ 550.000 k.k.
€ 5.140/m²
3572TA Utrecht
€ 525.000 k.k.
€ 6.562/m²
3543GR Utrecht
€ 350.000 k.k.
€ 6.363/m²
3522AC Utrecht
€ 535.000 k.k.
€ 5.691/m²
3527CS Utrecht
€ 335.000 k.k.
€ 5.075/m²
3526BL Utrecht
€ 400.000 k.k.
€ 4.166/m²
3552CH Utrecht
€ 420.000 k.k.
€ 6.461/m²
3527JH Utrecht
€ 339.000 k.k.
€ 3.896/m²
3545DG Utrecht
€ 1.075.000 k.k.
€ 5.779/m²
3522JN Utrecht
€ 950.000 k.k.
€ 6.506/m²
3541DZ Utrecht
€ 750.000 k.k.
€ 6.147/m²
3541EN Utrecht
€ 695.000 k.k.
€ 5.472/m²
3532HH Utrecht
€ 695.000 k.k.
€ 5.889/m²
3512HD Utrecht
€ 670.000 k.k.
€ 5.537/m²
3552CG Utrecht
€ 425.000 k.k.
€ 6.538/m²
3555EZ Utrecht
€ 649.500 k.k.
€ 3.798/m²
3522BA Utrecht
€ 399.000 k.k.
€ 5.619/m²
3511JH Utrecht
€ 385.000 k.k.
€ 7.403/m²
3524LV Utrecht
€ 400.000 k.k.
€ 5.714/m²
3511JH Utrecht
€ 345.000 k.k.
€ 7.840/m²
3527HM Utrecht
€ 319.000 k.k.
€ 4.038/m²
View recent sales and receive free quotes from local real estate agents. Compare more than 219 real estate agents in Utrecht.
Sold recently in Utrecht? Read the sales-oriented guide sell your home in Utrecht, compare sales agents in Utrecht or view the top sales agents in Utrecht for reference in your choice.
Real estate agents make sharper offers when they know you're comparing — ask for quotes for sale or purchase.
Short answers about housing prices, sold homes and comparing real estate agents in Utrecht.
The costs of a real estate agent in Utrecht vary per office, property type and sales approach. In Utrecht you can compare 219 real estate agents; therefore also look at the real estate agents in Utrecht to better compare fees, presentation and local experience.
On this page we currently show 3.879 sold houses in Utrecht from our selection. This helps you to better assess recent transactions and the local housing market.
Houses sold in Utrecht give insight into asking prices, house types and neighborhoods where recent transactions have taken place. Compare this also with the current housing stock in Utrecht to better understand the market.
You can use sold homes as a first market indication, but a local real estate agent can better take into account finishing, location, maintenance and current demand in Utrecht. Plan the next step via the guide selling a house in Utrecht.
Compare the 219 real estate agents in Utrecht on local sales experience, reviews, expected yield, commission and marketing approach. View real estate agents in Utrecht or the top 10 agents in Utrecht to quickly discover strong offices.
View current location data on residents, WOZ development, housing stock, energy consumption, business activity and safety in Utrecht. In 2025 were there 325.510 residents. The average WOZ value in 2025 is EUR 474.416.
These figures help to better assess and compare the housing stock in Utrecht with recent sold homes. Orient yourself then on suitable top real estate agents in Utrecht for sales advice in this region.
Residents
325.510
Last year: 2025
Average WOZ
EUR 474.416
Last year: 2025
Average income per person.
EUR 38.255
Source: AllNumbers
Crimes (current year)
25.985
Total registered
| Year | Residents |
|---|---|
| 2021 | 308.685 |
| 2022 | 310.610 |
| 2023 | 316.460 |
| 2024 | 323.020 |
| 2025 | 325.510 |
| Year | Average WOZ |
|---|---|
| 2021 | EUR 349.277 |
| 2022 | EUR 381.193 |
| 2023 | EUR 442.579 |
| 2024 | EUR 435.454 |
| 2025 | EUR 474.416 |
Hoger
148.860
Praktisch
45.840
Middelbaar
67.680
Europa
37.515
Nederland
186.915
Buiten Europa
101.045
Label A
47.799
Label C
25.699
Label B
17.523
Label D
13.066
Label F
12.655
Label G
11.728
Label E
11.306
Label A+
9.677
Label A++
5.013
Label A+++
4.232
Label A++++
725
Label A+++++
21
| Year | Gas (m3) | Electricity (kWh) |
|---|---|---|
| 2020 | 664 | 2.253 |
| 2021 | 740 | 2.328 |
| 2022 | 572 | 2.170 |
| 2023 | 484 | 2.028 |
| 2024 | 468 | 2.042 |
Hoekwoning
Gas: 791 • Electricity: 2.601
Huurwoning
Gas: 421 • Electricity: 1.821
Koopwoning
Gas: 587 • Electricity: 2.316
Appartement
Gas: 368 • Electricity: 1.760
Tussenwoning
Gas: 700 • Electricity: 2.361
Vrijstaande woning
Gas: 1.325 • Electricity: 3.953
Twee-onder-één-kap woning
Gas: 898 • Electricity: 3.142
Total number of company establishments: 55.750
| Period | Crimes |
|---|---|
| jan 2025 | 1.938 |
| jan 2026 | 2.042 |
| jul 2025 | 2.284 |
| jun 2025 | 2.296 |
| mei 2025 | 2.085 |
| mrt 2025 | 2.095 |
| nov 2024 | 2.183 |
| nov 2025 | 2.313 |
| okt 2024 | 2.124 |
| okt 2025 | 2.340 |
| sep 2024 | 1.881 |
| sep 2025 | 2.221 |
These figures give an indicative picture of safety trends in the living environment of Utrecht.
Short answers based on current local statistics, handy for a quick comparison of the living environment.
Utrecht telt in 2025 ongeveer 325.510 inwoners.
De gemiddelde WOZ-waarde in Utrecht is in 2025 circa € 474.416.
Het gemiddelde inkomen per inwoner in Utrecht ligt rond € 38.255 per jaar.
Voor het huidige jaar gaat het om ongeveer 25.985 geregistreerde misdrijven. Gebruik deze cijfers als indicatie en vergelijk trends per periode.
In Utrecht komt vooral "Appartementen" veel voor, met ongeveer 108.137 woningen.