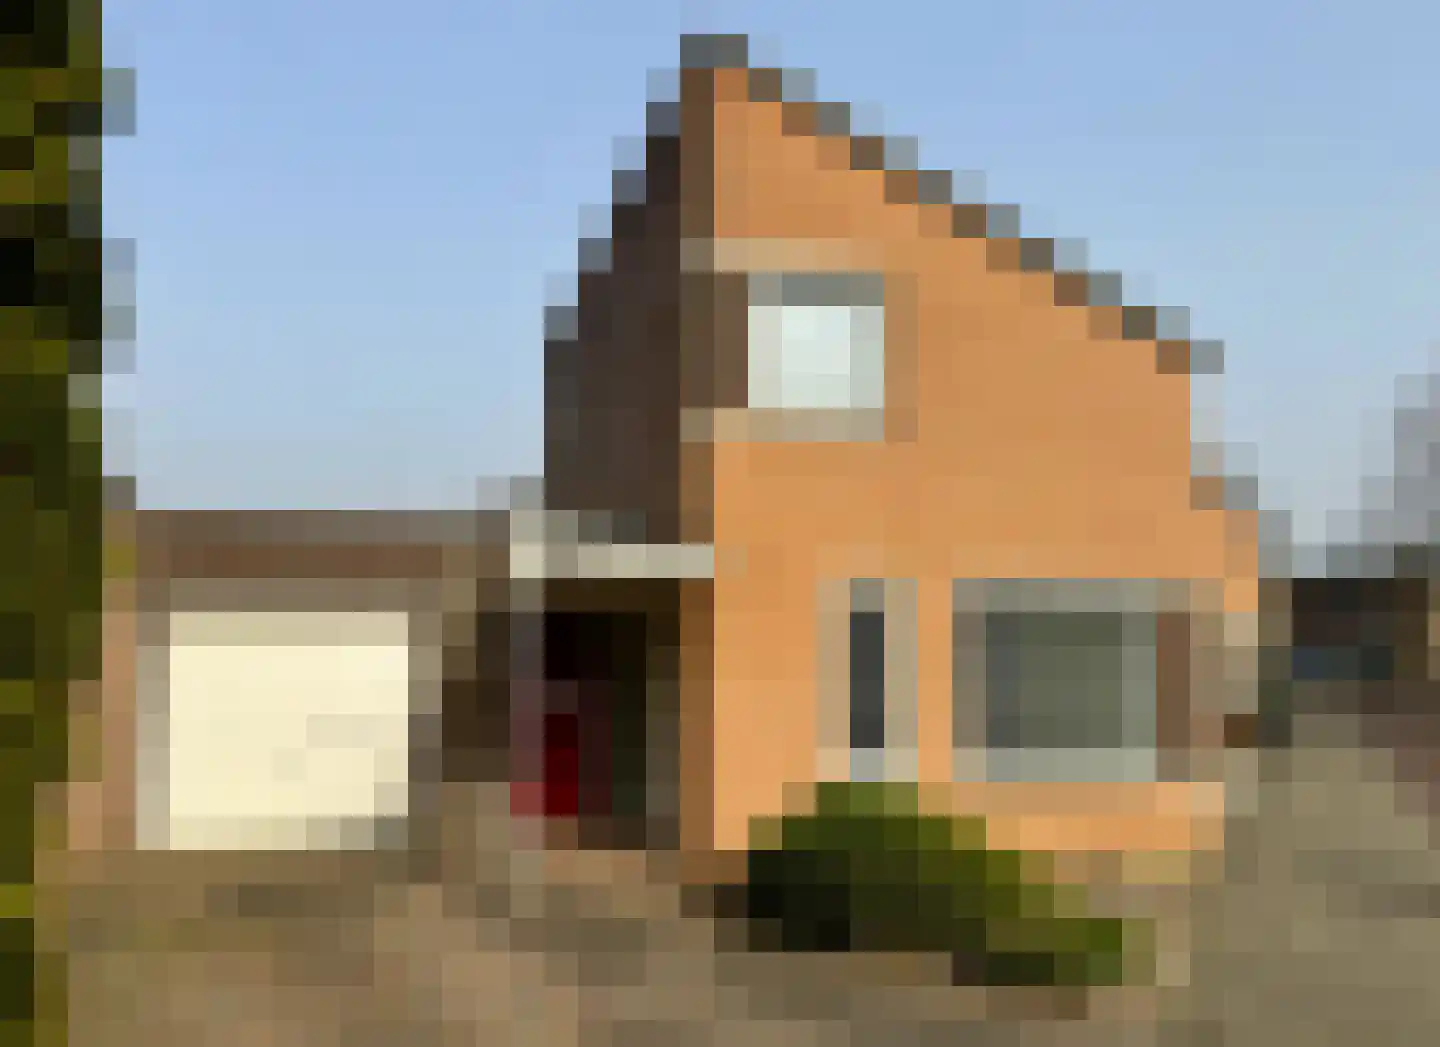
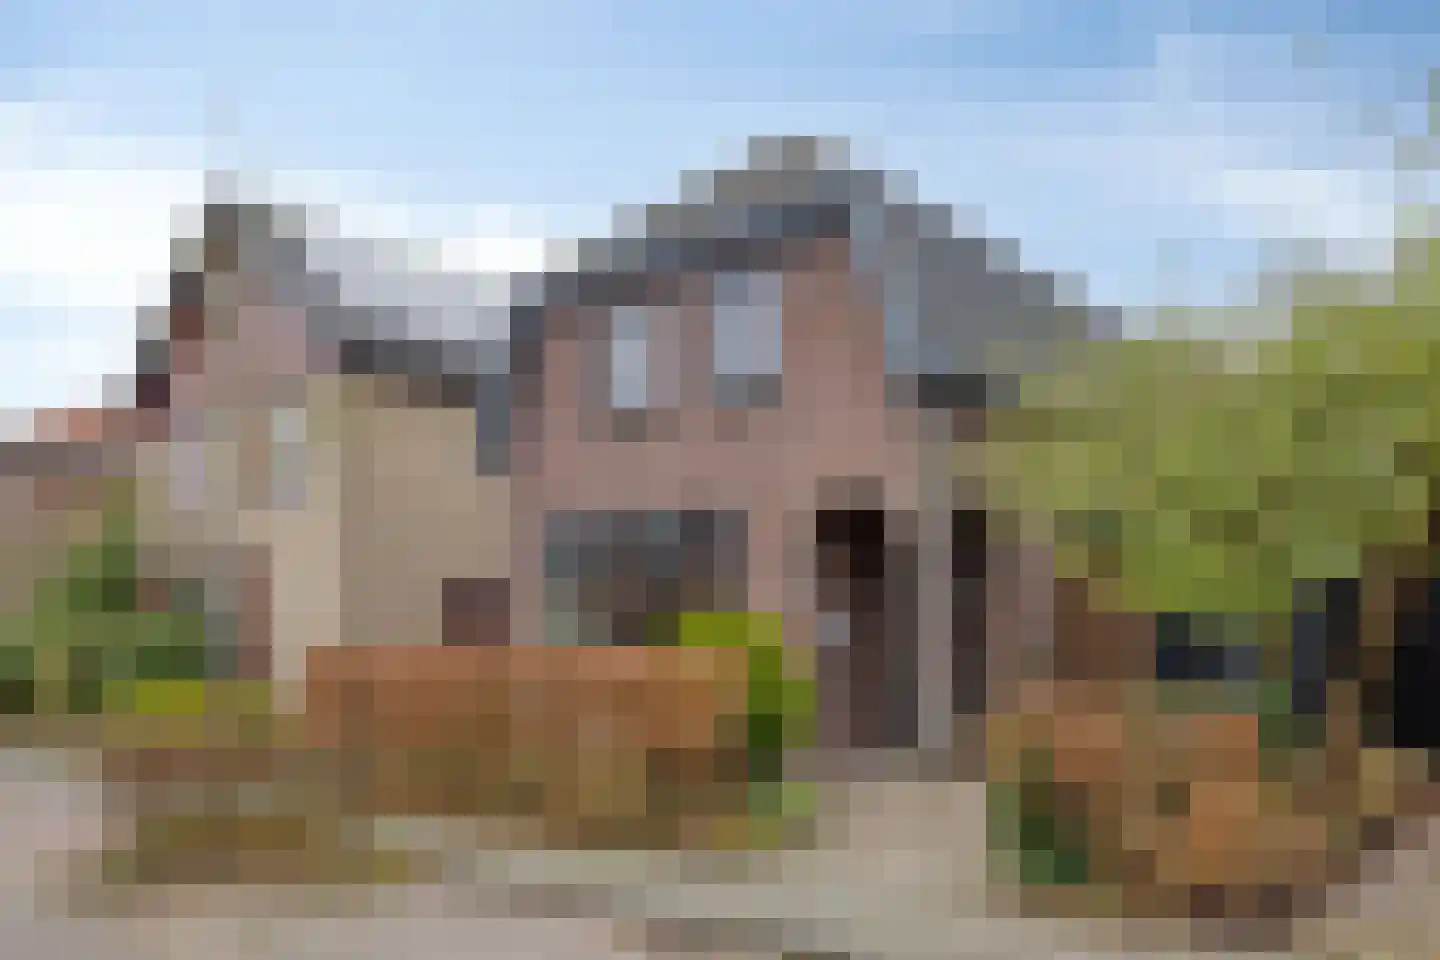
Housing offer in Waalre

Searching in 277 houses in Waalre

Connected to: Vastgoed Nederland NVM Makelaars

View the current housing stock in Waalre and quickly filter by price, living area, rooms and more. There are currently 277 houses in this place within our selection. View also 164 sold houses in Waalre for extra insight into the local housing market.

Selection

Search and filter homes

Set your preferences and discover homes that suit you.

Total supply 242.868
Filters

Set price, area and other characteristics. Adjust a filter or click on Show homes. Location changes directly above.

Reset filters

You search for

  • Place Waalre

Selling a home in Waalre? Compare realtor offers

Get free quotes from real estate agents with local market knowledge. Compare more than 143 real estate agents in Waalre.

Free request a quote

  • Quotes in Waalre
  • Non-binding
  • Personal
  • Compare free rates

Selling a home in Waalre? View the sales-oriented guide sell a house in Waalre, compare all real estate agents in Waalre or view the top 10 real estate agents in Waalre for extra context to your choice.

Compare multiple quotes

Real estate agents make sharper offers when they know you're comparing — ask for quotes for sale or purchase.

Frequently asked questions about homes in Waalre

Practical answers about housing supply, sales and comparing real estate agents in Waalre.

Residential and neighborhood statistics in Waalre

View current location data on residents, WOZ development, housing stock, energy consumption, business activity and safety in Waalre. In 2026 were there 17.862 residents. The average WOZ value in 2025 is EUR 531.000.

These figures help to better assess and compare the housing stock in Waalre with recent sold homes. Orient yourself then on suitable top real estate agents in Waalre for sales advice in this region.

Residents

17.862

Last year: 2026

Average WOZ

EUR 531.000

Last year: 2025

Average income per person.

EUR 43.300

Source: AllNumbers

Crimes (current year)

488

Total registered

Demographics and WOZ development

Inhabitants per year

Inhabitants per year in Waalre
Year Residents
2022 17.626
2023 17.980
2024 17.988
2025 17.898
2026 17.862

Annual WOZ value

WOZ value per year in Waalre
Year Average WOZ
2021 EUR 386.000
2022 EUR 420.000
2023 EUR 491.000
2024 EUR 509.000
2025 EUR 531.000

Composition of residents

Age build-up

65+: 4.442 0-15: 2.910 15-25: 1.760 25-45: 3.734 45-65: 5.052

Education level

Hoger

52

Praktisch

17

Middelbaar

31

Origin of residents (2025)

Europa

1.854

Nederland

13.810

Buiten Europa

2.234

Housing stock and construction periods

Types of homes

Hoekwoningen 1.491
Appartementen 1.533
Tussenwoningen 2.765
Vrijstaande woningen 1.501
Twee-onder-één-kap woningen 1.153

Construction period of buildings

Voor 1700 4
1700 tot 1900 61
1900 tot 1925 95
1925 tot 1950 699
1950 tot 1970 1.925
1970 tot 1980 1.651
1980 tot 1990 1.096
1990 tot 2000 707
2000 tot 2010 512
2010 tot 2020 426
2020 en later 484

Energy and sustainability

Energy label distribution

Label C

2.292

Label A

1.776

Label B

1.181

Label D

830

Label F

617

Label E

521

Label G

408

Label A+

190

Label A+++

147

Label A++++

66

Label A++

49

Label A+++++

2

Average energy consumption per year

Average energy consumption per year in Waalre
Year Gas (m3) Electricity (kWh)
2020 1.490 3.190
2021 1.660 3.240
2022 1.300 3.040
2023 1.070 2.920
2024 1.030 3.000

Consumption per house type

Hoekwoning

Gas: 1.040 • Electricity: 2.810

Huurwoning

Gas: 730 • Electricity: 2.060

Koopwoning

Gas: 1.190 • Electricity: 3.210

Appartement

Gas: 590 • Electricity: 1.870

Tussenwoning

Gas: 950 • Electricity: 2.530

Vrijstaande woning

Gas: 1.690 • Electricity: 4.560

Twee-onder-één-kap woning

Gas: 1.250 • Electricity: 3.240

Business activity in Waalre (2025)

Handel en HORECA 365
Nijverheid en energie 280
Zakelijke dienstverlening 825
Overheid, onderwijs en zorg 505
Landbouw, bosbouw en visserij 25
Vervoer, informatie en communicatie 165
Financiele diensten en onroerendgoed 220
Cultuur, recreatie en overige diensten 245

Total number of company establishments: 2.635

Recent crime statistics

Recent crime statistics in Waalre
Period Crimes
jan 2025 37
jan 2026 22
jul 2025 35
jun 2025 46
mei 2025 53
mrt 2025 44
nov 2024 38
nov 2025 44
okt 2024 61
okt 2025 50
sep 2024 40
sep 2025 25

These figures give an indicative picture of safety trends in the living environment of Waalre.

Frequently asked questions about living in Waalre

Short answers based on current local statistics, handy for a quick comparison of the living environment.

Hoeveel inwoners heeft Waalre?

Waalre telt in 2026 ongeveer 17.862 inwoners.

Wat is de gemiddelde WOZ-waarde in Waalre?

De gemiddelde WOZ-waarde in Waalre is in 2025 circa € 531.000.

Wat is het gemiddelde inkomen per inwoner in Waalre?

Het gemiddelde inkomen per inwoner in Waalre ligt rond € 43.300 per jaar.

Hoe veilig is wonen in Waalre?

Voor het huidige jaar gaat het om ongeveer 488 geregistreerde misdrijven. Gebruik deze cijfers als indicatie en vergelijk trends per periode.

Welke woningtypen komen het meest voor in Waalre?

In Waalre komt vooral "Tussenwoningen" veel voor, met ongeveer 2.765 woningen.

Receive free, non-binding quotes

Compare multiple real estate agents and choose the best match.