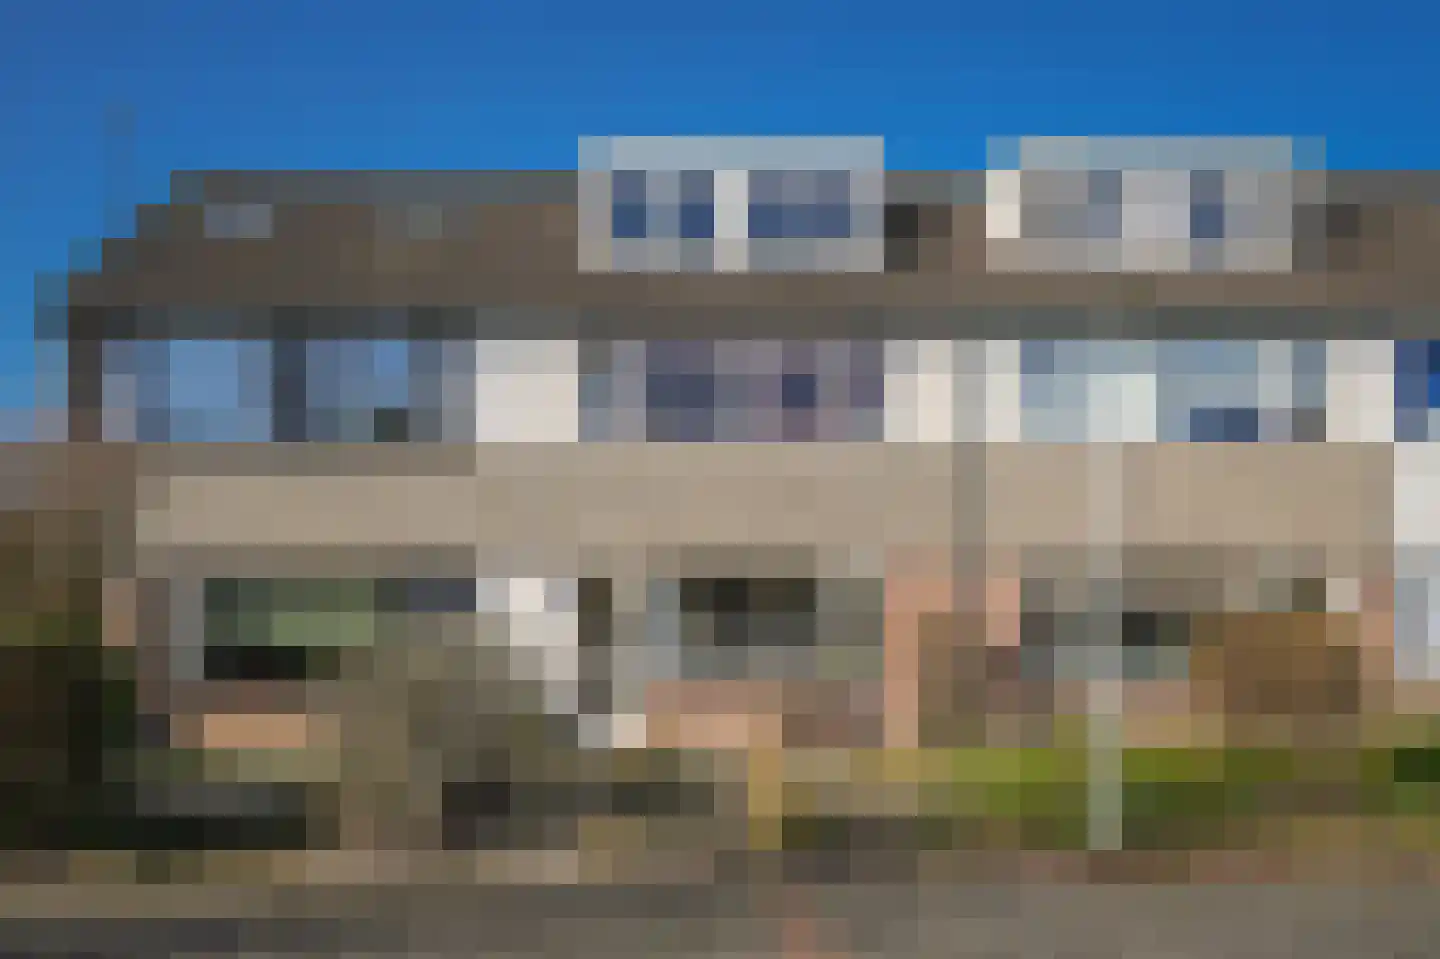
- Sold
Huibersakker 15
5301WX Zaltbommel
€ 485.000 k.k.
€ 4.181/m²
- Living area
- 116 m²
- Land area
- 157 m²
- Bedrooms
- 4
View 152 sold houses in Zaltbommel
Type to search. Use arrow down and arrow up to navigate through results and press Enter to open.
Hidden search suggestions.
Compare sold homes in Zaltbommel or view the current offering in this location directly.
On this page you will find recently sold homes in Zaltbommel. Use this overview to better estimate selling prices, popular neighborhoods, and the local housing supply before you choose a real estate agent. Also view the current housing supply with 234 houses in Zaltbommel.
5301WX Zaltbommel
€ 485.000 k.k.
€ 4.181/m²
5302VD Zaltbommel
€ 419.000 k.k.
€ 5.442/m²
5302VA Zaltbommel
€ 795.000 k.k.
€ 3.768/m²
5301PA Zaltbommel
€ 699.000 k.k.
€ 4.691/m²
5301VA Zaltbommel
€ 395.000 k.k.
€ 3.185/m²
5301VM Zaltbommel
€ 449.000 k.k.
€ 3.904/m²
5301BT Zaltbommel
€ 875.000 k.k.
€ 6.481/m²
5301TH Zaltbommel
€ 550.000 k.k.
€ 5.729/m²
5301VA Zaltbommel
€ 360.000 k.k.
€ 3.870/m²
5302TE Zaltbommel
€ 498.000 k.k.
€ 4.184/m²
5301EC Zaltbommel
€ 649.000 k.k.
€ 4.879/m²
5301RT Zaltbommel
€ 489.000 k.k.
€ 4.445/m²
5301WE Zaltbommel
€ 325.000 k.k.
€ 3.250/m²
5302VR Zaltbommel
€ 575.000 k.k.
€ 5.275/m²
5301ZH Zaltbommel
€ 445.000 k.k.
€ 3.903/m²
5302XM Zaltbommel
€ 585.000 k.k.
€ 4.398/m²
5301AG Zaltbommel
€ 375.000 k.k.
€ 5.136/m²
5302TB Zaltbommel
€ 495.000 k.k.
€ 4.159/m²
5302VH Zaltbommel
€ 469.000 k.k.
€ 3.974/m²
5301VX Zaltbommel
€ 465.000 k.k.
€ 4.650/m²
5301JG Zaltbommel
€ 439.000 k.k.
€ 4.027/m²
5301EJ Zaltbommel
€ 925.000 k.k.
€ 4.282/m²
5301GN Zaltbommel
€ 775.000 k.k.
€ 4.905/m²
5301SV Zaltbommel
€ 375.000 k.k.
€ 3.260/m²
5301VL Zaltbommel
€ 335.000 k.k.
€ 3.764/m²
5302XH Zaltbommel
€ 435.000 k.k.
€ 4.728/m²
5302TG Zaltbommel
€ 485.000 k.k.
€ 4.330/m²
5301EH Zaltbommel
€ 625.000 k.k.
€ 4.882/m²
Bekijk recente verkopen en ontvang gratis offertes van lokale makelaars. Vergelijk meer dan 28 makelaars in Zaltbommel.
Recent verkocht in Zaltbommel? Lees de verkoopgerichte gids huis verkopen in Zaltbommel, vergelijk verkoopmakelaars in Zaltbommel of bekijk de beste verkoopmakelaars in Zaltbommel voor referentie bij jouw keuze.
Makelaars maken scherpere voorstellen als ze weten dat je vergelijkt — vraag offertes aan voor verkoop of aankoop.
Short answers about housing prices, sold homes and comparing real estate agents in Zaltbommel.
De kosten van een makelaar in Zaltbommel verschillen per kantoor, woningtype en verkoopaanpak. In Zaltbommel kun je 28 real estate agents vergelijken; bekijk daarom ook de makelaars in Zaltbommel om tarieven, presentatie en lokale ervaring beter naast elkaar te zetten.
On this page we currently show 152 sold houses in Zaltbommel from our selection. This helps you to better assess recent transactions and the local housing market.
Houses sold in Zaltbommel give insight into asking prices, house types and neighborhoods where recent transactions have taken place. Compare this also with the current housing stock in Zaltbommel to better understand the market.
Je kunt verkochte woningen gebruiken als eerste marktindicatie, maar een lokale makelaar kan beter rekening houden met afwerking, ligging, onderhoud en actuele vraag in Zaltbommel. Plan de volgende stap via de gids huis verkopen in Zaltbommel.
Vergelijk de 28 real estate agents in Zaltbommel op lokale verkoopervaring, reviews, verwachte opbrengst, courtage en marketingaanpak. Bekijk verkoopmakelaars in Zaltbommel of de top 10 makelaars in Zaltbommel om snel sterke kantoren te ontdekken.
View current location data on residents, WOZ development, housing stock, energy consumption, business activity and safety in Zaltbommel. In 2025 were there 13.485 residents. The average WOZ value in 2025 is EUR 382.000.
These figures help to better assess and compare the housing stock in Zaltbommel with recent sold homes. Orient yourself then on suitable top real estate agents in Zaltbommel for sales advice in this region.
Residents
13.485
Last year: 2025
Average WOZ
EUR 382.000
Last year: 2025
Average income per person.
EUR 35.000
Source: AllNumbers
Crimes (current year)
711
Total registered
| Year | Residents |
|---|---|
| 2021 | 13.070 |
| 2022 | 13.325 |
| 2023 | 13.530 |
| 2024 | 13.565 |
| 2025 | 13.485 |
| Year | Average WOZ |
|---|---|
| 2021 | EUR 273.000 |
| 2022 | EUR 303.000 |
| 2023 | EUR 344.000 |
| 2024 | EUR 358.000 |
| 2025 | EUR 382.000 |
Hoger
3.410
Praktisch
2.750
Middelbaar
3.950
Europa
1.090
Nederland
10.265
Buiten Europa
2.130
Label A
2.022
Label C
1.452
Label B
1.188
Label D
401
Label F
302
Label G
268
Label A+++
229
Label A+
167
Label E
165
Label A++
65
Label A++++
57
Label A+++++
1
| Year | Gas (m3) | Electricity (kWh) |
|---|---|---|
| 2020 | 1.140 | 2.800 |
| 2021 | 1.280 | 2.820 |
| 2022 | 1.000 | 2.660 |
| 2023 | 840 | 2.520 |
| 2024 | 830 | 2.580 |
Hoekwoning
Gas: 910 • Electricity: 2.570
Huurwoning
Gas: 680 • Electricity: 2.040
Koopwoning
Gas: 960 • Electricity: 2.860
Appartement
Gas: 580 • Electricity: 1.820
Tussenwoning
Gas: 790 • Electricity: 2.410
Vrijstaande woning
Gas: 1.380 • Electricity: 4.060
Twee-onder-één-kap woning
Gas: 1.060 • Electricity: 3.110
Total number of company establishments: 2.250
| Period | Crimes |
|---|---|
| jan 2025 | 49 |
| jan 2026 | 96 |
| jul 2025 | 39 |
| jun 2025 | 50 |
| mei 2025 | 46 |
| mrt 2025 | 49 |
| nov 2024 | 55 |
| nov 2025 | 80 |
| okt 2024 | 50 |
| okt 2025 | 86 |
| sep 2024 | 54 |
| sep 2025 | 69 |
These figures give an indicative picture of safety trends in the living environment of Zaltbommel.
Short answers based on current local statistics, handy for a quick comparison of the living environment.
Zaltbommel telt in 2025 ongeveer 13.485 inwoners.
De gemiddelde WOZ-waarde in Zaltbommel is in 2025 circa € 382.000.
Het gemiddelde inkomen per inwoner in Zaltbommel ligt rond € 35.000 per jaar.
Voor het huidige jaar gaat het om ongeveer 711 geregistreerde misdrijven. Gebruik deze cijfers als indicatie en vergelijk trends per periode.
In Zaltbommel komt vooral "Tussenwoningen" veel voor, met ongeveer 2.907 woningen.