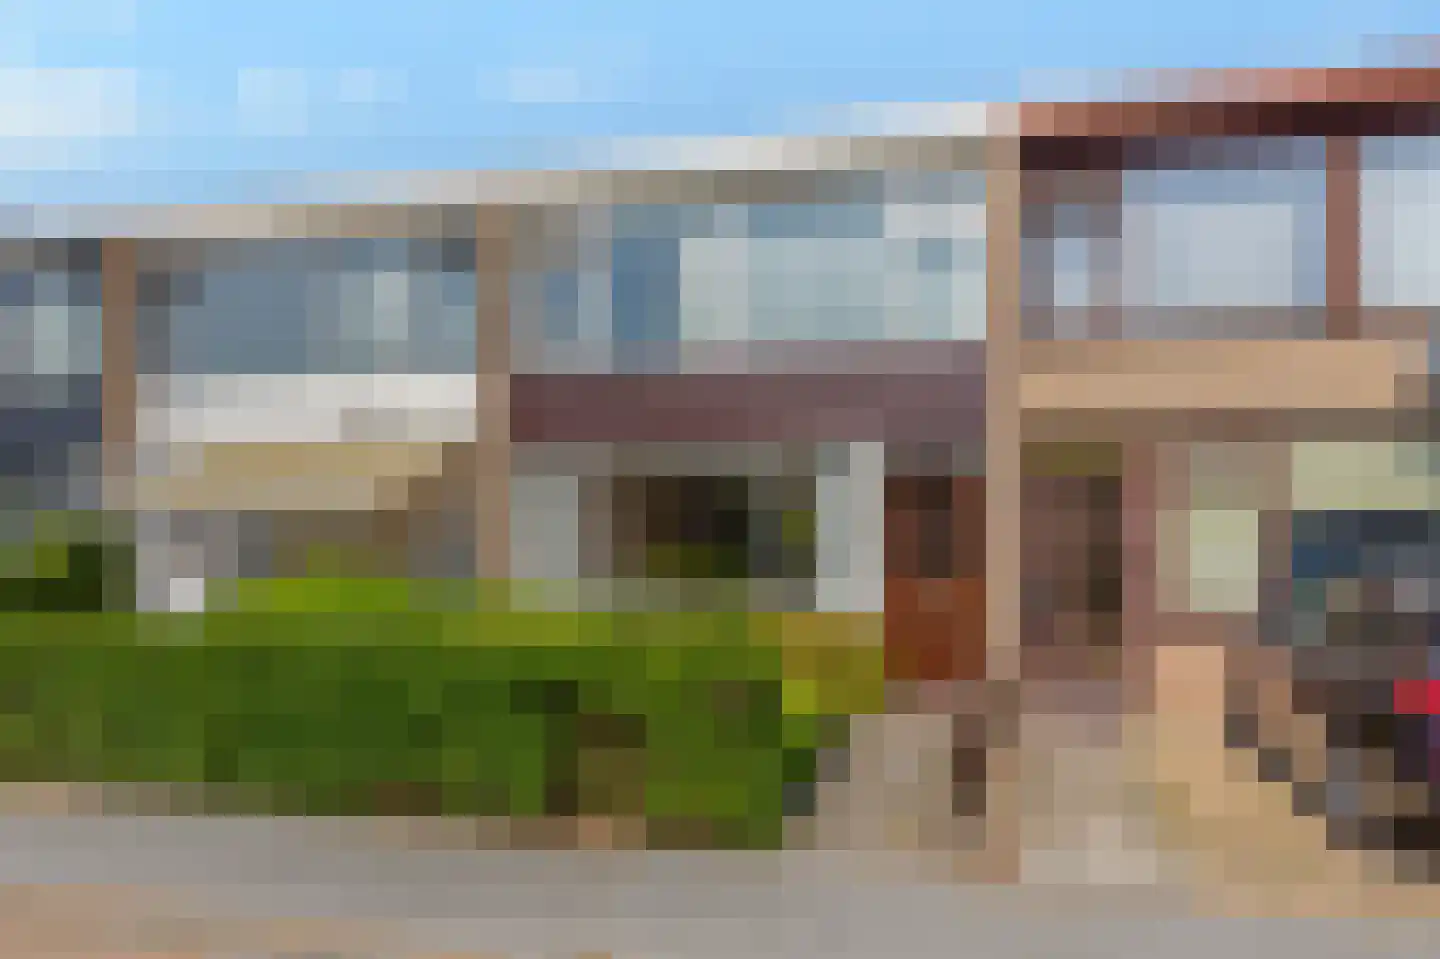
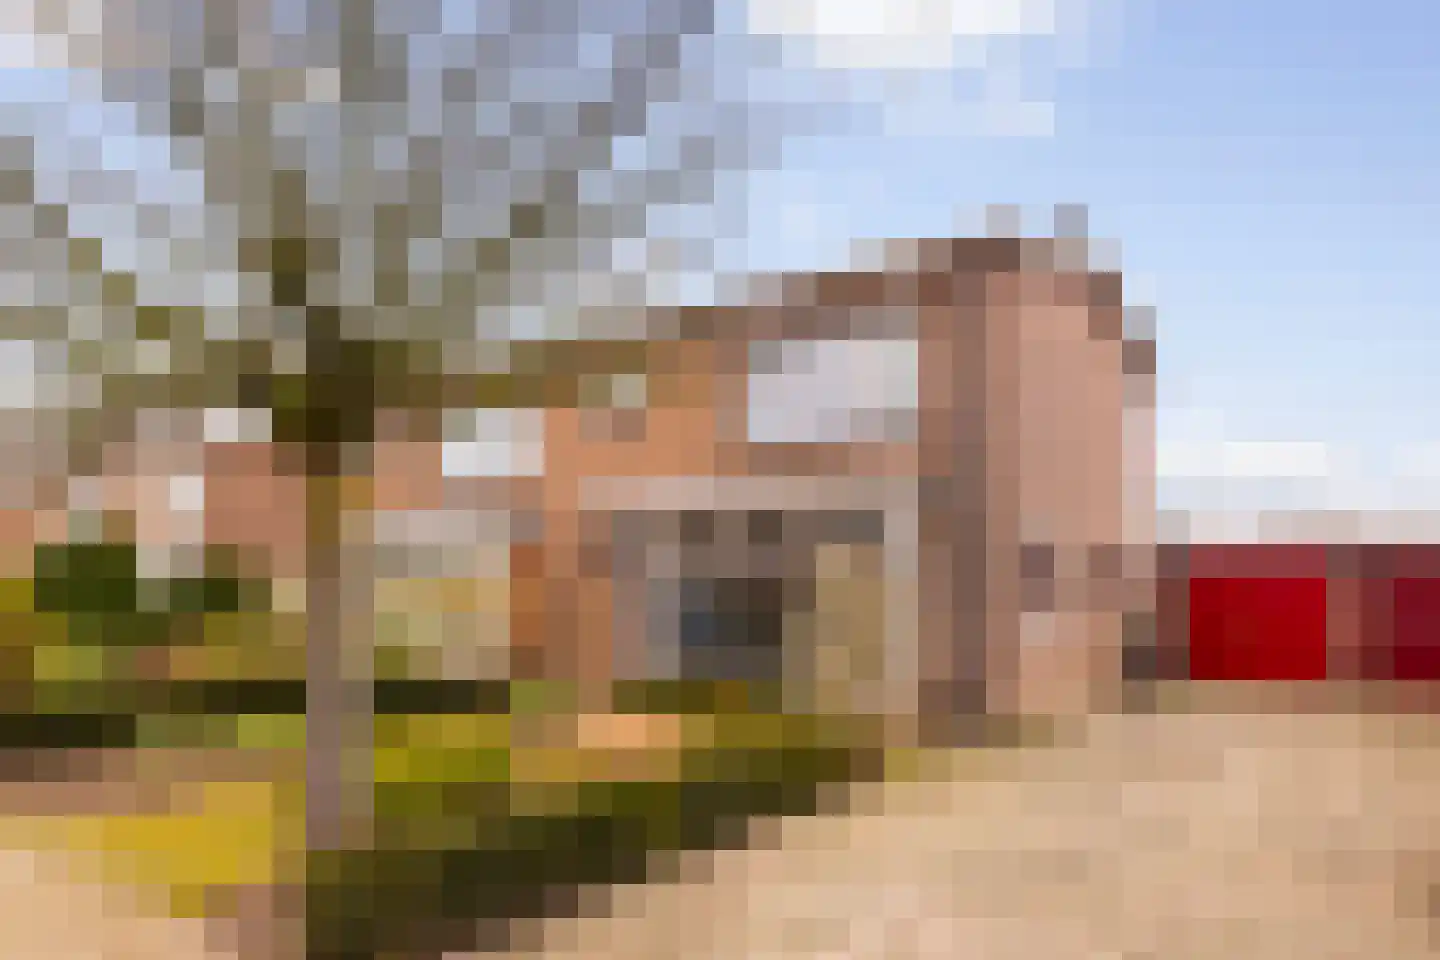
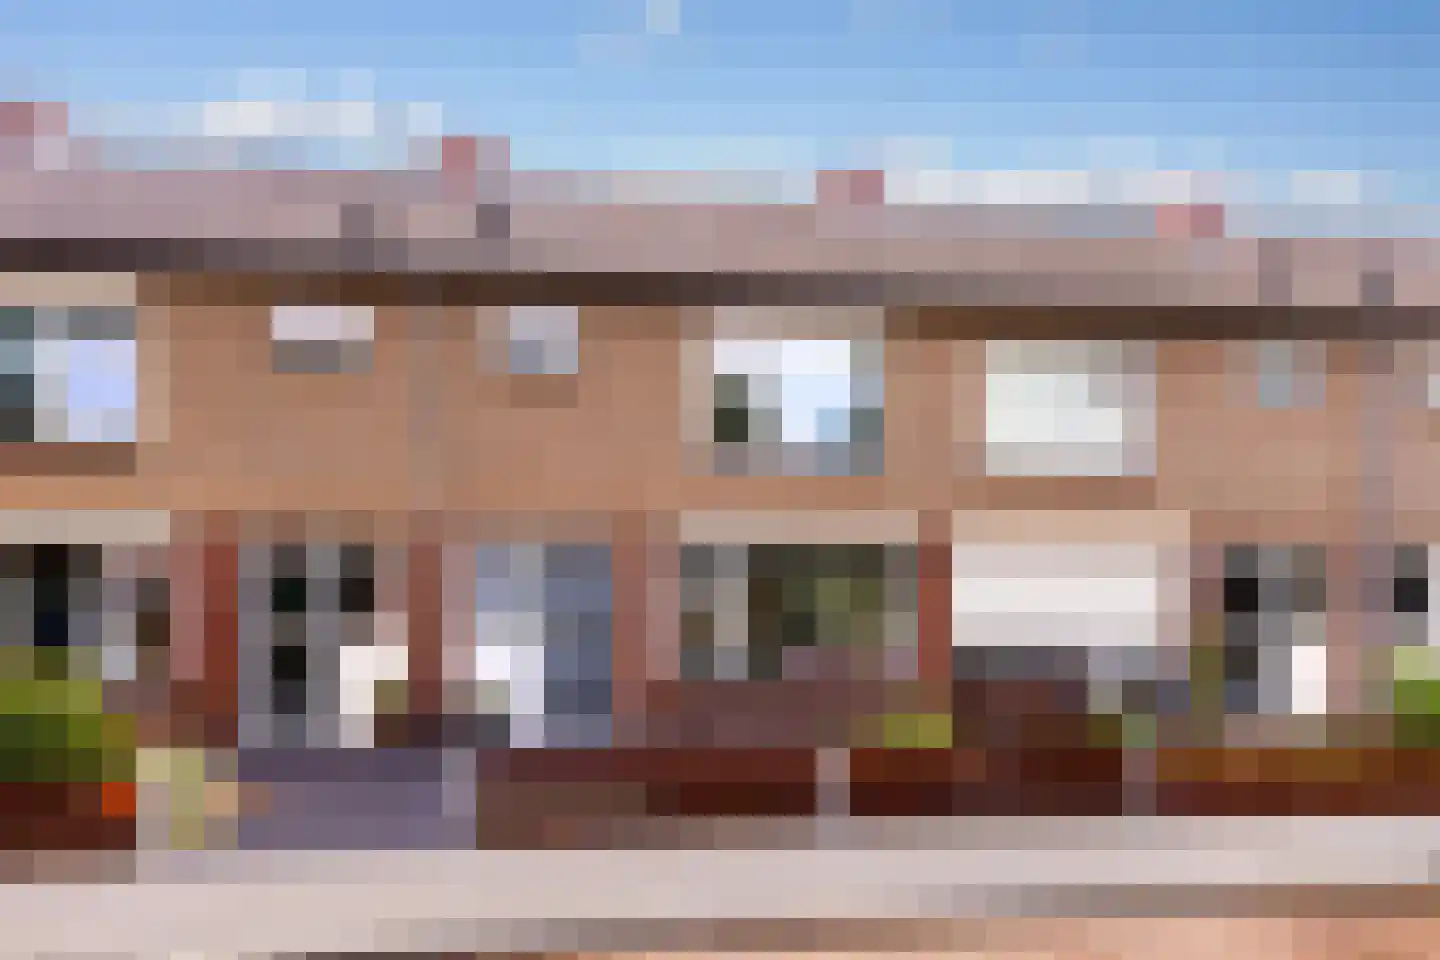
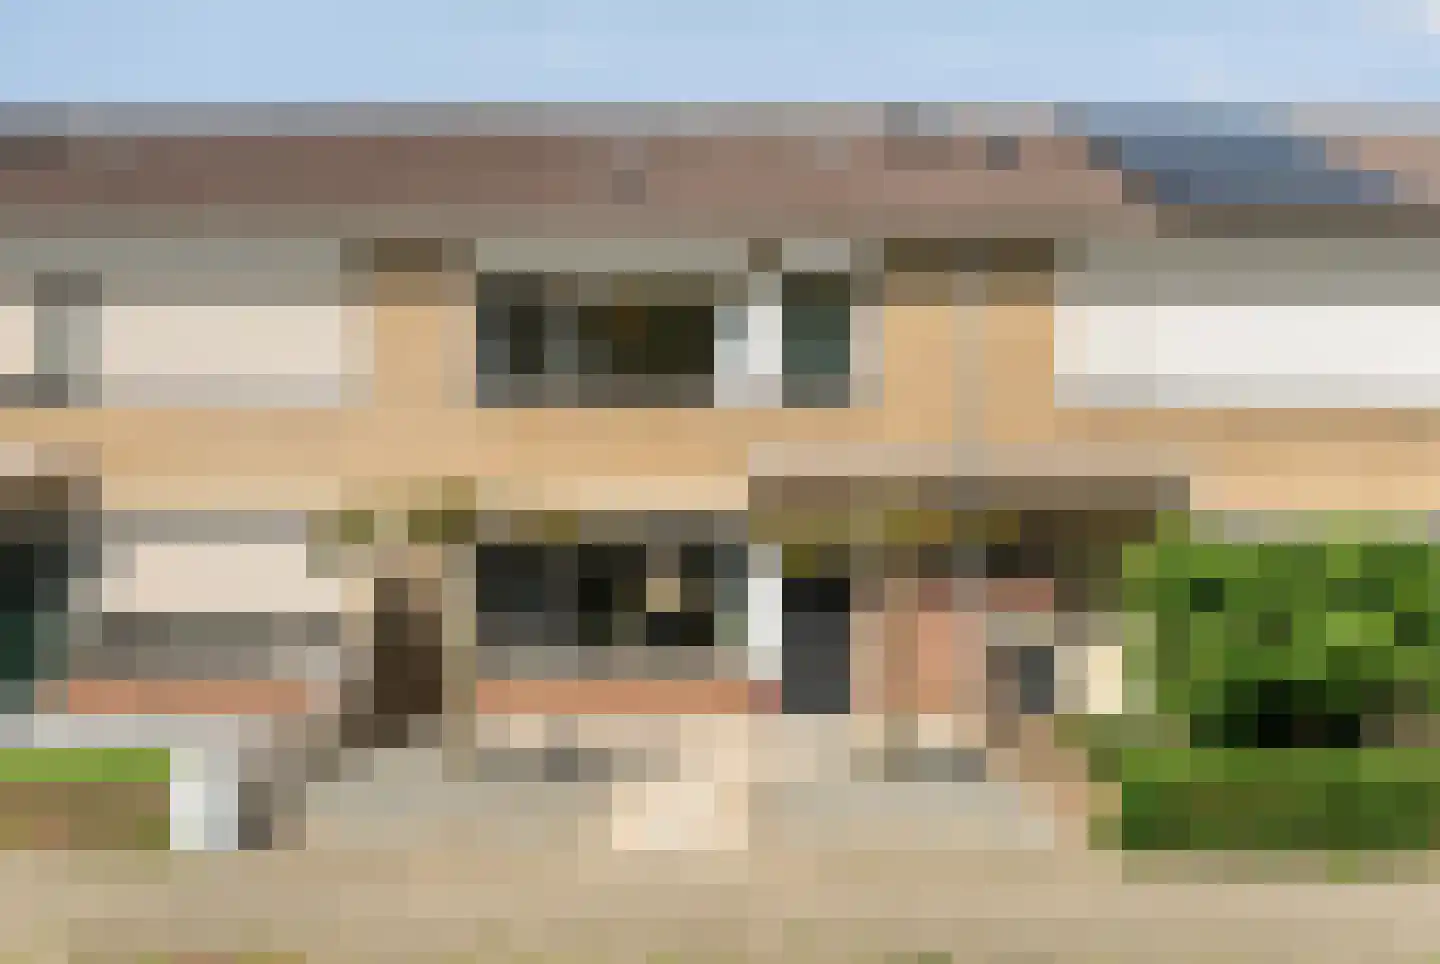
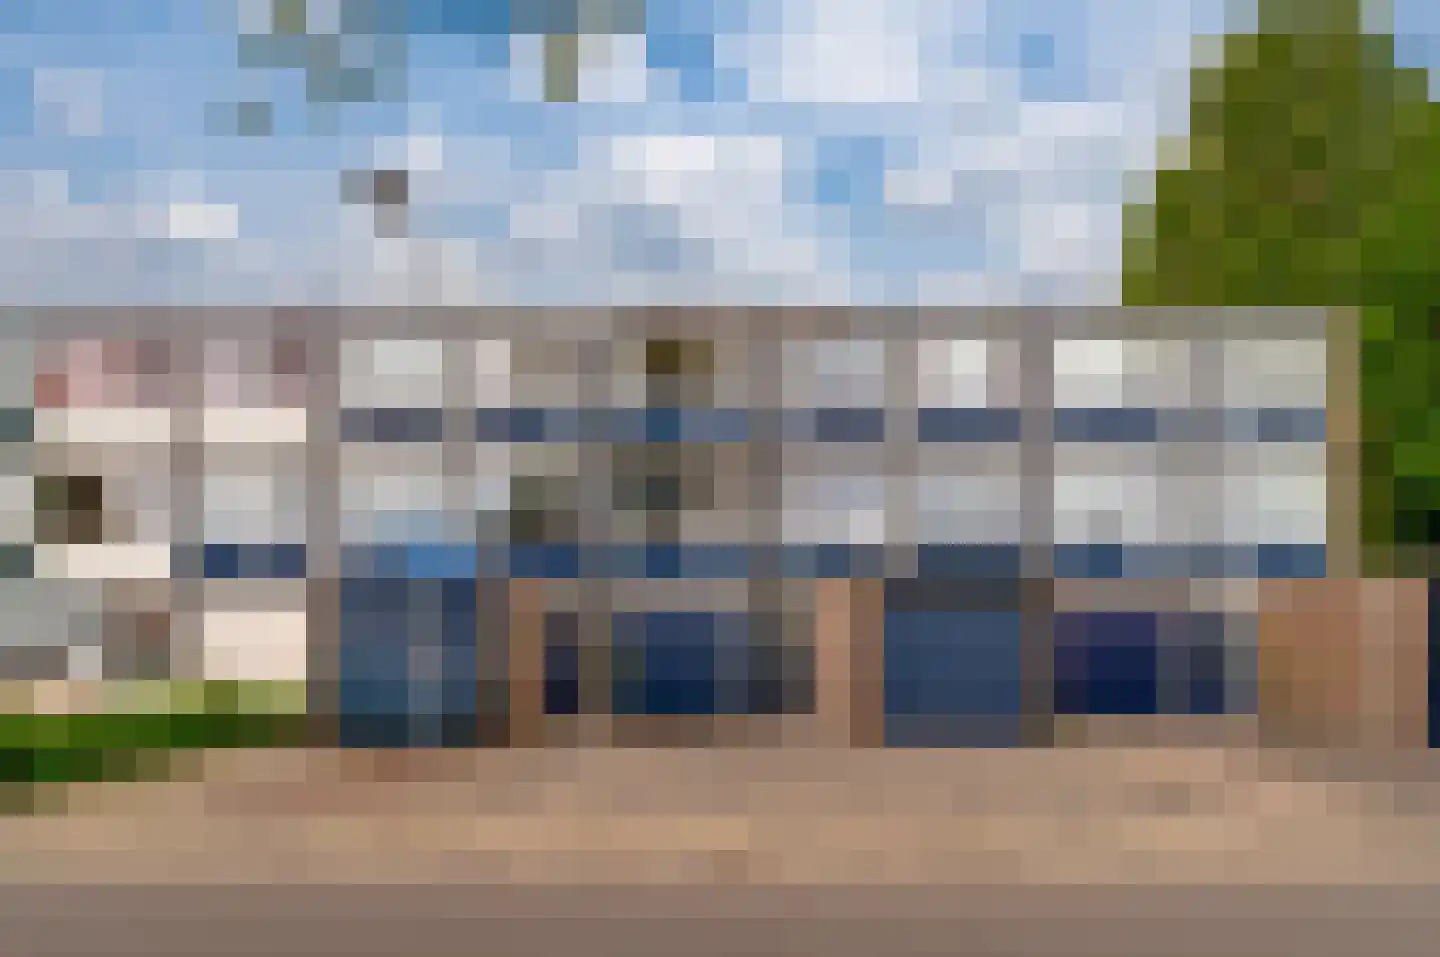
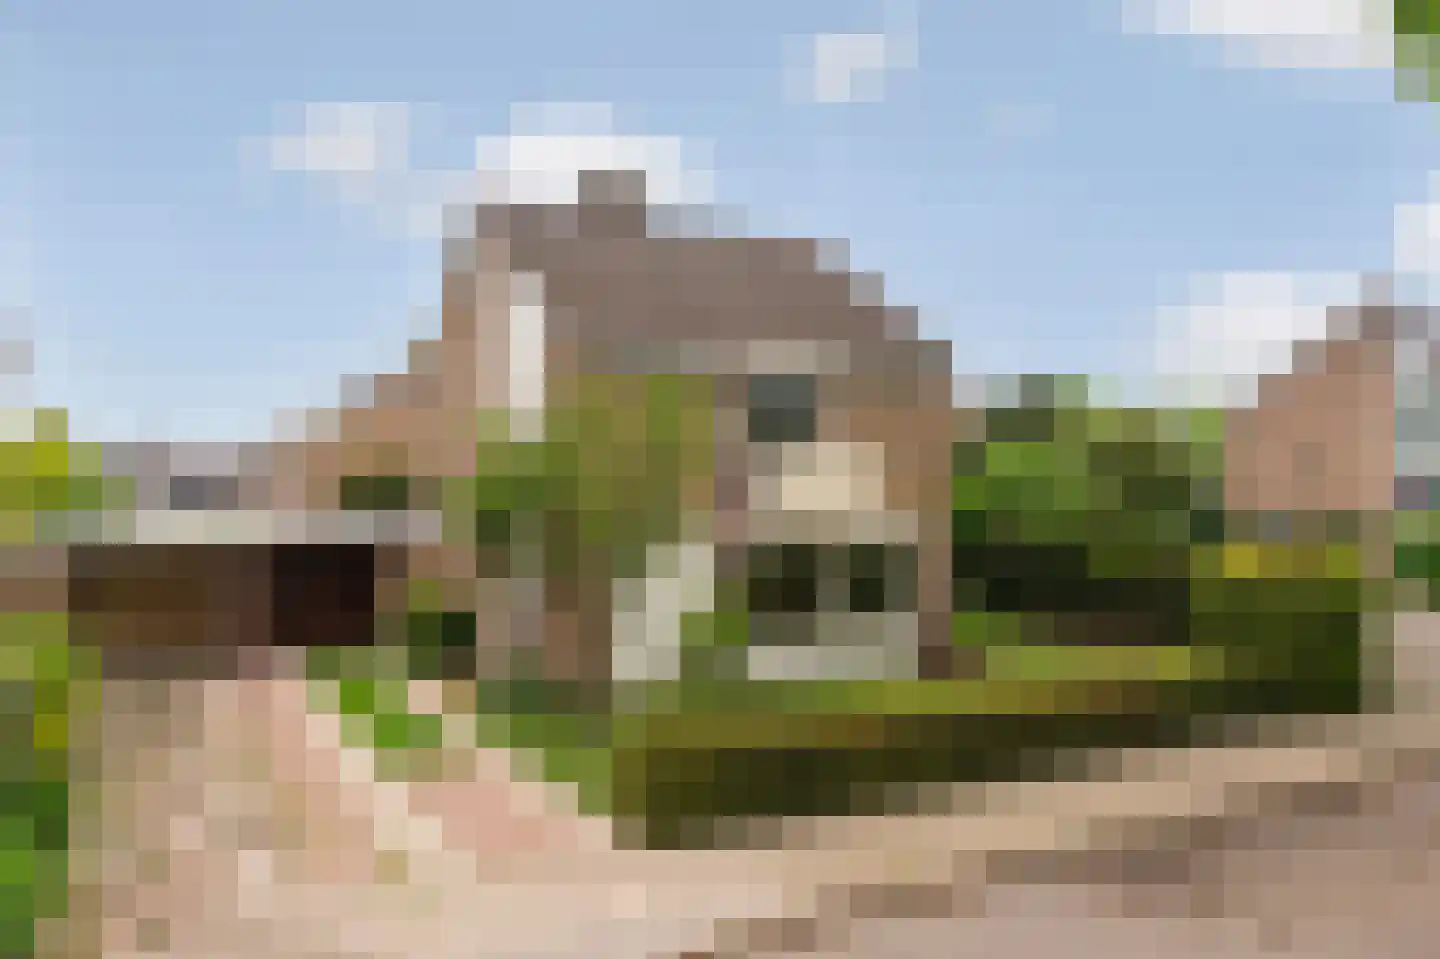
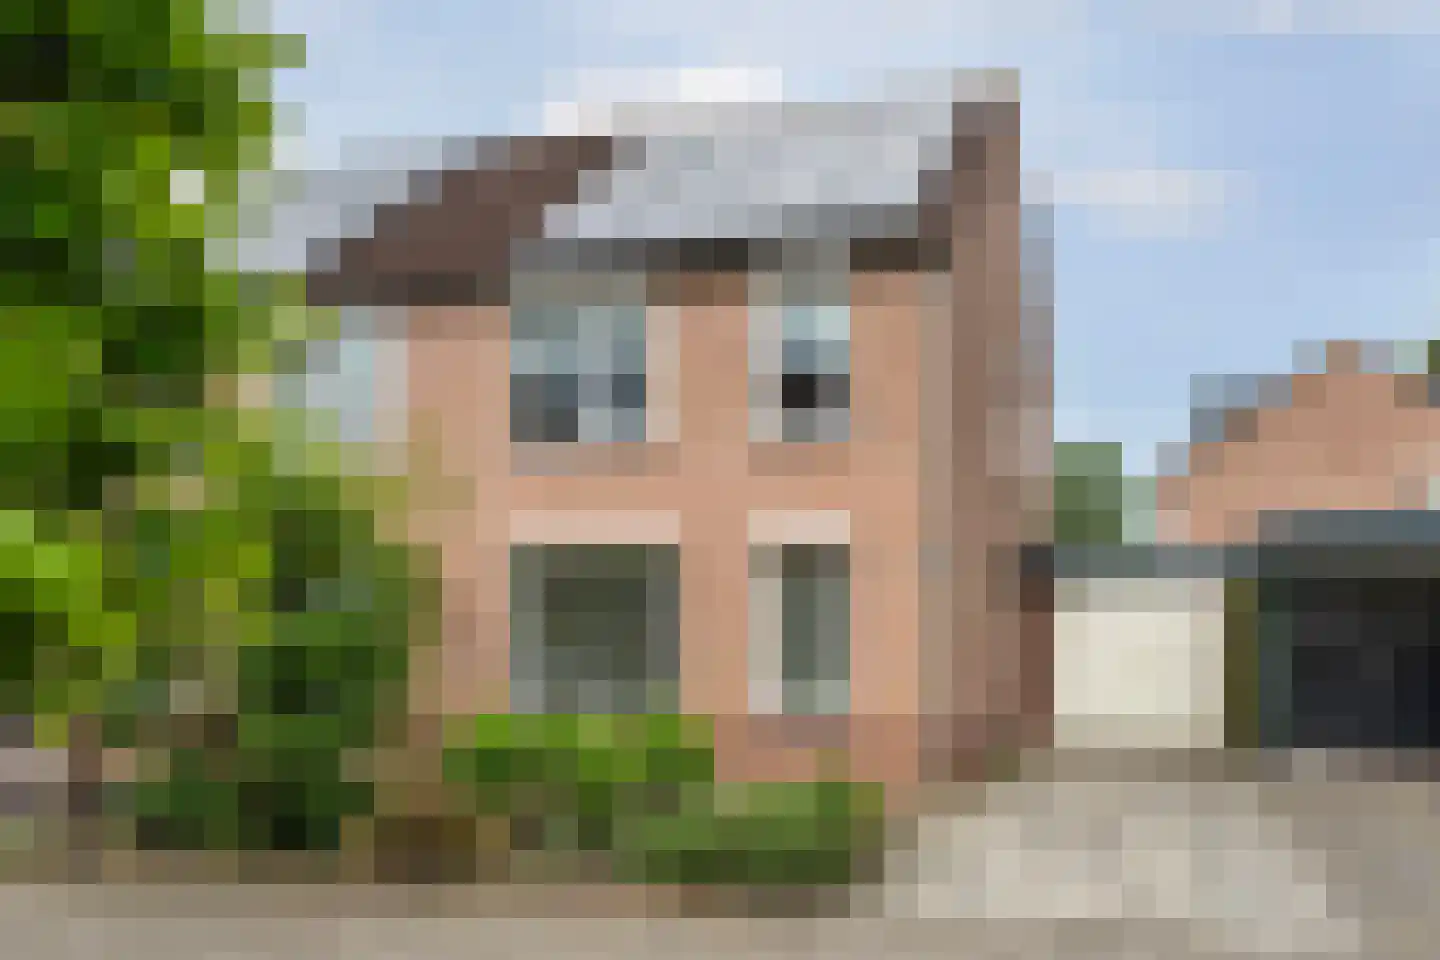
- Available
Stresemannstraat 23
6904NT Zevenaar
€ 465.000 k.k.
€ 3.974/m²
- Living area
- 117 m²
- Land area
- 230 m²
- Bedrooms
- 4
Searching in 345 houses in Zevenaar
Type to search. Use arrow down and arrow up to navigate through results and press Enter to open.
Hidden search suggestions.
View current properties in Zevenaar or search targeted on street, postal code and property characteristics.
View the current housing stock in Zevenaar and quickly filter by price, living area, rooms and more. There are currently 345 houses in this place within our selection. View also 265 sold houses in Zevenaar for extra insight into the local housing market.
6904NT Zevenaar
€ 465.000 k.k.
€ 3.974/m²
6901LE Zevenaar
€ 275.000 k.k.
€ 2.778/m²
6901DG Zevenaar
€ 425.000 k.k.
€ 3.829/m²
6901ED Zevenaar
€ 375.000 k.k.
€ 3.571/m²
6903CN Zevenaar
€ 950.000 k.k.
€ 3.393/m²
6902BA Zevenaar
€ 375.000 k.k.
€ 3.125/m²
6905BH Zevenaar
€ 775.000 k.k.
€ 4.613/m²
6904BA Zevenaar
€ 335.000 k.k.
€ 2.617/m²
6902AP Zevenaar
€ 375.000 k.k.
€ 3.099/m²
6905TJ Zevenaar
€ 399.000 k.k.
€ 4.071/m²
6905BH Zevenaar
€ 950.000 k.k.
€ 5.278/m²
6904MP Zevenaar
€ 745.000 k.k.
€ 4.233/m²
6903HD Zevenaar
€ 399.000 k.k.
€ 2.625/m²
6901GM Zevenaar
€ 345.000 k.k.
€ 3.670/m²
6904KK Zevenaar
€ 345.000 k.k.
€ 2.851/m²
6904NA Zevenaar
€ 445.000 k.k.
€ 3.090/m²
6905TJ Zevenaar
€ 415.000 k.k.
€ 3.517/m²
6901EB Zevenaar
€ 469.000 k.k.
€ 4.510/m²
6905AR Zevenaar
€ 699.000 k.k.
€ 4.396/m²
6903AX Zevenaar
€ 389.000 k.k.
€ 2.526/m²
6904AM Zevenaar
€ 350.000 k.k.
€ 2.893/m²
6901AM Zevenaar
€ 340.000 k.k.
€ 3.656/m²
6902BB Zevenaar
€ 475.000 k.k.
€ 3.231/m²
6902AN Zevenaar
€ 595.000 k.k.
€ 3.420/m²
6901MD Zevenaar
€ 595.000 k.k.
€ 3.940/m²
6905WT Zevenaar
€ 398.500 k.k.
€ 4.332/m²
6902PP Zevenaar
€ 795.000 k.k.
€ 5.336/m²
6904KK Zevenaar
€ 350.000 k.k.
€ 2.823/m²
Get free quotes from real estate agents with local market knowledge. Compare more than 36 real estate agents in Zevenaar.
Selling a home in Zevenaar? View the sales-oriented guide sell a house in Zevenaar, compare all real estate agents in Zevenaar or view the top 10 real estate agents in Zevenaar for extra context to your choice.
Real estate agents make sharper offers when they know you're comparing — ask for quotes for sale or purchase.
Practical answers about housing supply, sales and comparing real estate agents in Zevenaar.
The costs of a real estate agent in Zevenaar depend on commission, setup costs, property presentation and the chosen service. Compare the 36 real estate agents in Zevenaar via the real estate agent page and request multiple quotes to compare rates and approach well.
Within our selection, we are currently showing 345 houses in Zevenaar. View also the sold houses in Zevenaar to compare the current offering with recent transactions.
Take into account not only price and living area but also maintenance, energy label, location, outdoor space and sales status. This way you compare houses in Zevenaar on more than just the asking price.
A local real estate agent knows the neighborhoods, recent transactions and demand in Zevenaar. By comparing 36 real estate agents in the region you get a better insight into prices, sales strategy and expected yield; the top 10 in Zevenaar provides a useful starting point.
Yes, when making a sales plan, a valuation in Zevenaar is wise. You gain insight into a realistic asking price and can then compare offers from real estate agents specifically.
View current location data on residents, WOZ development, housing stock, energy consumption, business activity and safety in Zevenaar. In 2026 were there 26.678 residents. The average WOZ value in 2025 is EUR 323.000.
These figures help to better assess and compare the housing stock in Zevenaar with recent sold homes. Orient yourself then on suitable top real estate agents in Zevenaar for sales advice in this region.
Residents
26.678
Last year: 2026
Average WOZ
EUR 323.000
Last year: 2025
Average income per person.
EUR 32.000
Source: AllNumbers
Crimes (current year)
820
Total registered
| Year | Residents |
|---|---|
| 2021 | 25.500 |
| 2022 | 26.020 |
| 2023 | 26.315 |
| 2024 | 26.370 |
| 2025 | 26.475 |
| 2026 | 26.678 |
| Year | Average WOZ |
|---|---|
| 2021 | EUR 227.000 |
| 2022 | EUR 255.000 |
| 2023 | EUR 292.000 |
| 2024 | EUR 309.000 |
| 2025 | EUR 323.000 |
Hoger
5.230
Praktisch
5.010
Middelbaar
8.840
Europa
1.925
Nederland
21.265
Buiten Europa
3.285
Label C
3.834
Label A
3.336
Label B
1.873
Label D
1.789
Label E
674
Label F
556
Label G
410
Label A+
257
Label A+++
231
Label A++
97
Label A++++
18
Label A+++++
14
| Year | Gas (m3) | Electricity (kWh) |
|---|---|---|
| 2020 | 1.100 | 2.830 |
| 2021 | 1.230 | 2.840 |
| 2022 | 960 | 2.680 |
| 2023 | 790 | 2.570 |
| 2024 | 790 | 2.640 |
Hoekwoning
Gas: 850 • Electricity: 2.680
Huurwoning
Gas: 690 • Electricity: 2.090
Koopwoning
Gas: 860 • Electricity: 2.860
Appartement
Gas: 570 • Electricity: 1.950
Tussenwoning
Gas: 780 • Electricity: 2.500
Vrijstaande woning
Gas: 1.180 • Electricity: 3.870
Twee-onder-één-kap woning
Gas: 900 • Electricity: 2.970
Total number of company establishments: 2.975
| Period | Crimes |
|---|---|
| jan 2026 | 72 |
| jul 2025 | 60 |
| jun 2025 | 65 |
| mei 2025 | 76 |
| mrt 2025 | 100 |
| mrt 2026 | 95 |
| nov 2024 | 65 |
| nov 2025 | 79 |
| okt 2024 | 73 |
| okt 2025 | 77 |
| sep 2024 | 77 |
| sep 2025 | 64 |
These figures give an indicative picture of safety trends in the living environment of Zevenaar.
Short answers based on current local statistics, handy for a quick comparison of the living environment.
Zevenaar telt in 2026 ongeveer 26.678 inwoners.
De gemiddelde WOZ-waarde in Zevenaar is in 2025 circa € 323.000.
Het gemiddelde inkomen per inwoner in Zevenaar ligt rond € 32.000 per jaar.
Voor het huidige jaar gaat het om ongeveer 820 geregistreerde misdrijven. Gebruik deze cijfers als indicatie en vergelijk trends per periode.
In Zevenaar komt vooral "Tussenwoningen" veel voor, met ongeveer 5.087 woningen.