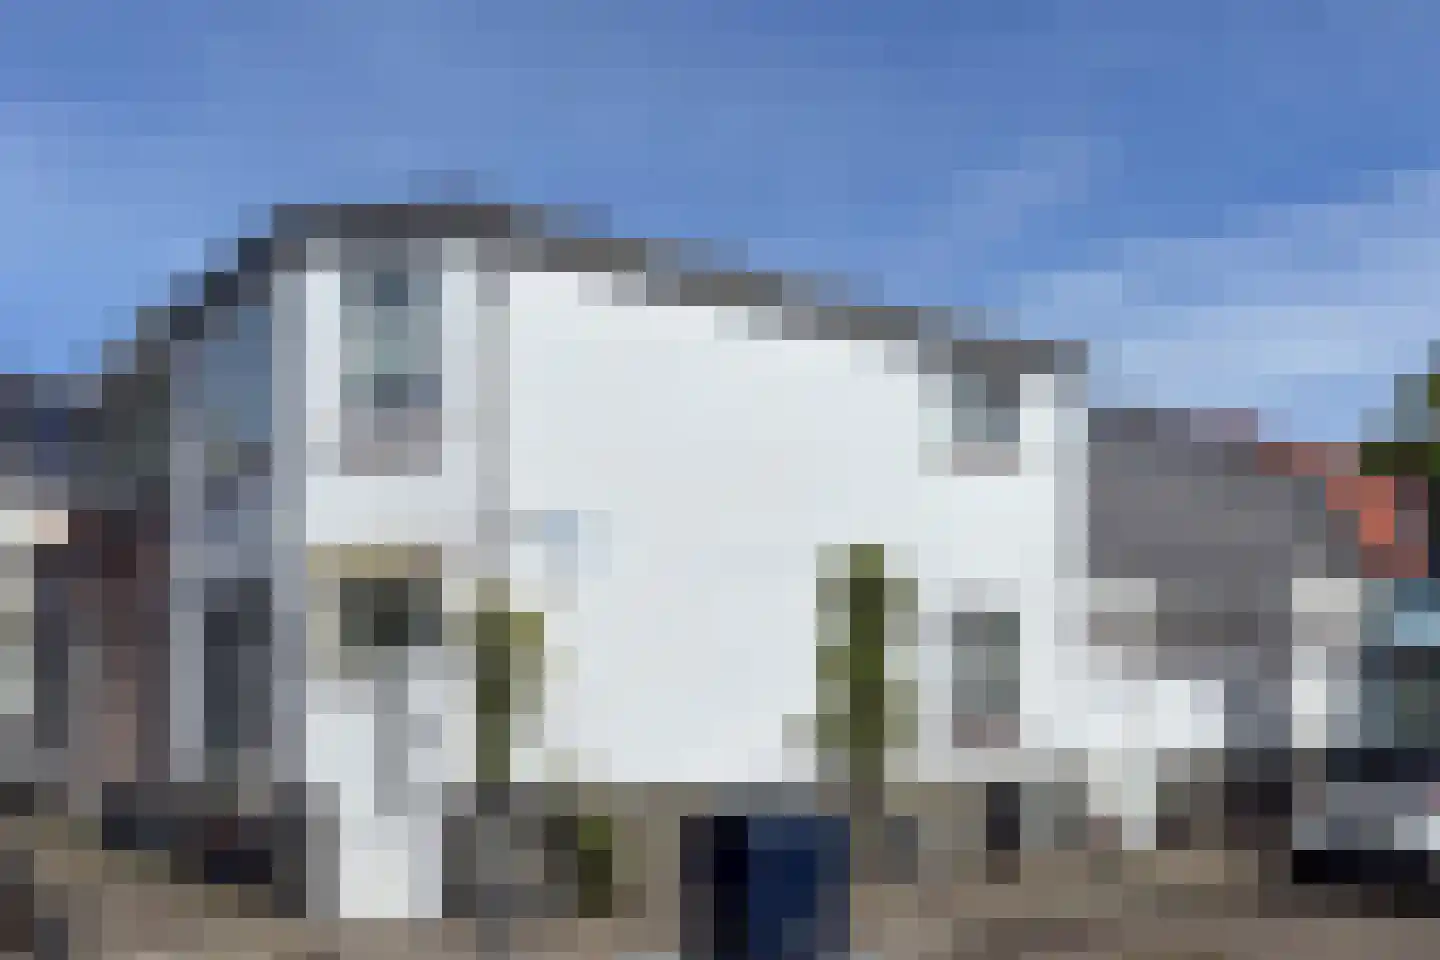
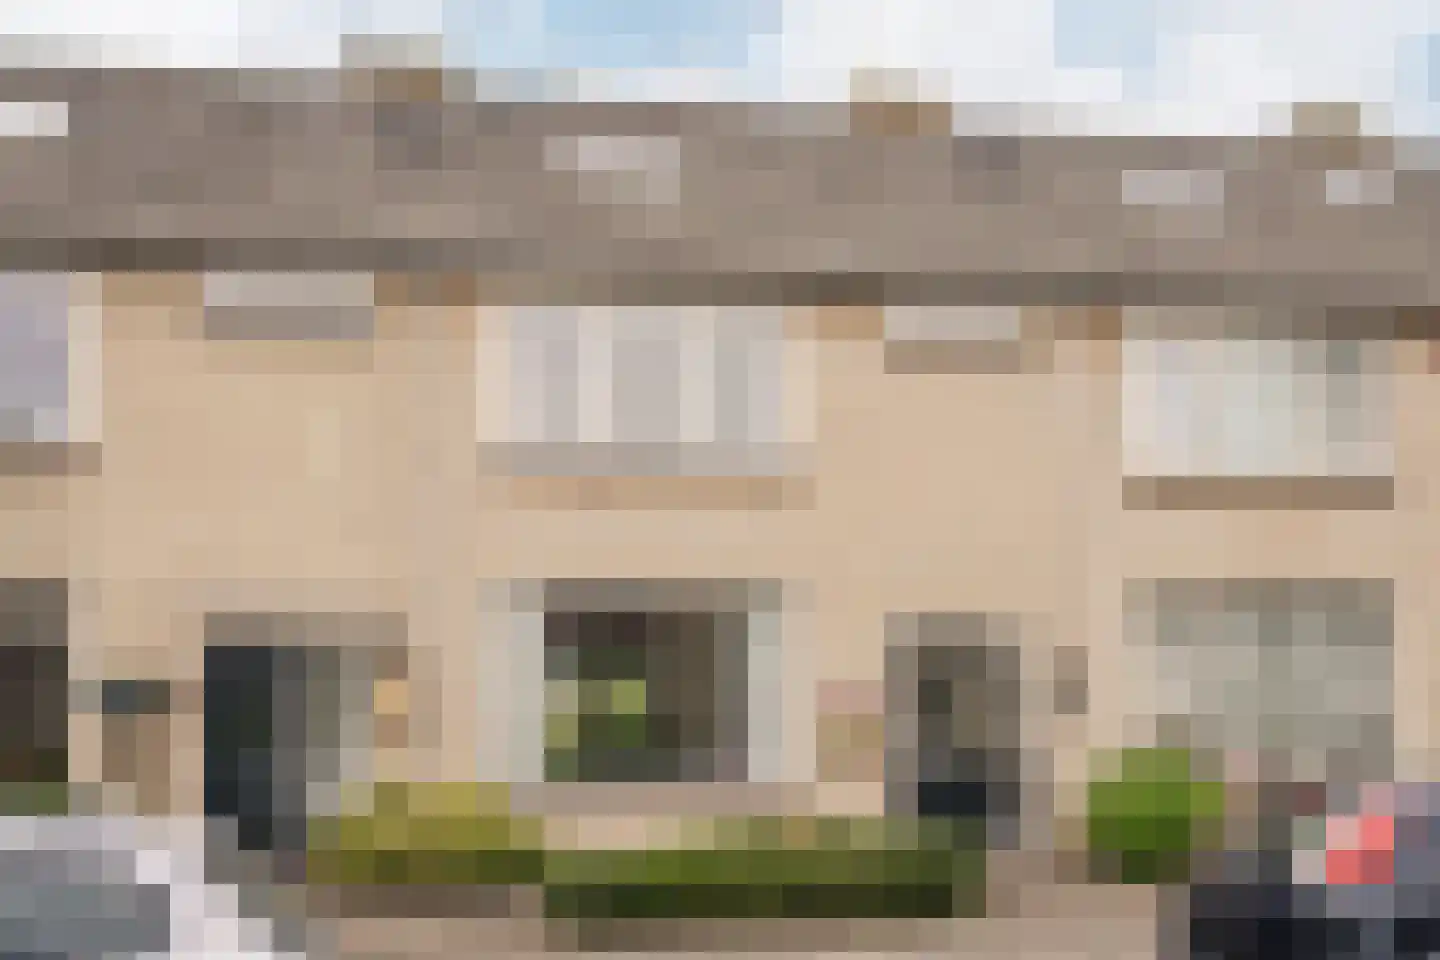
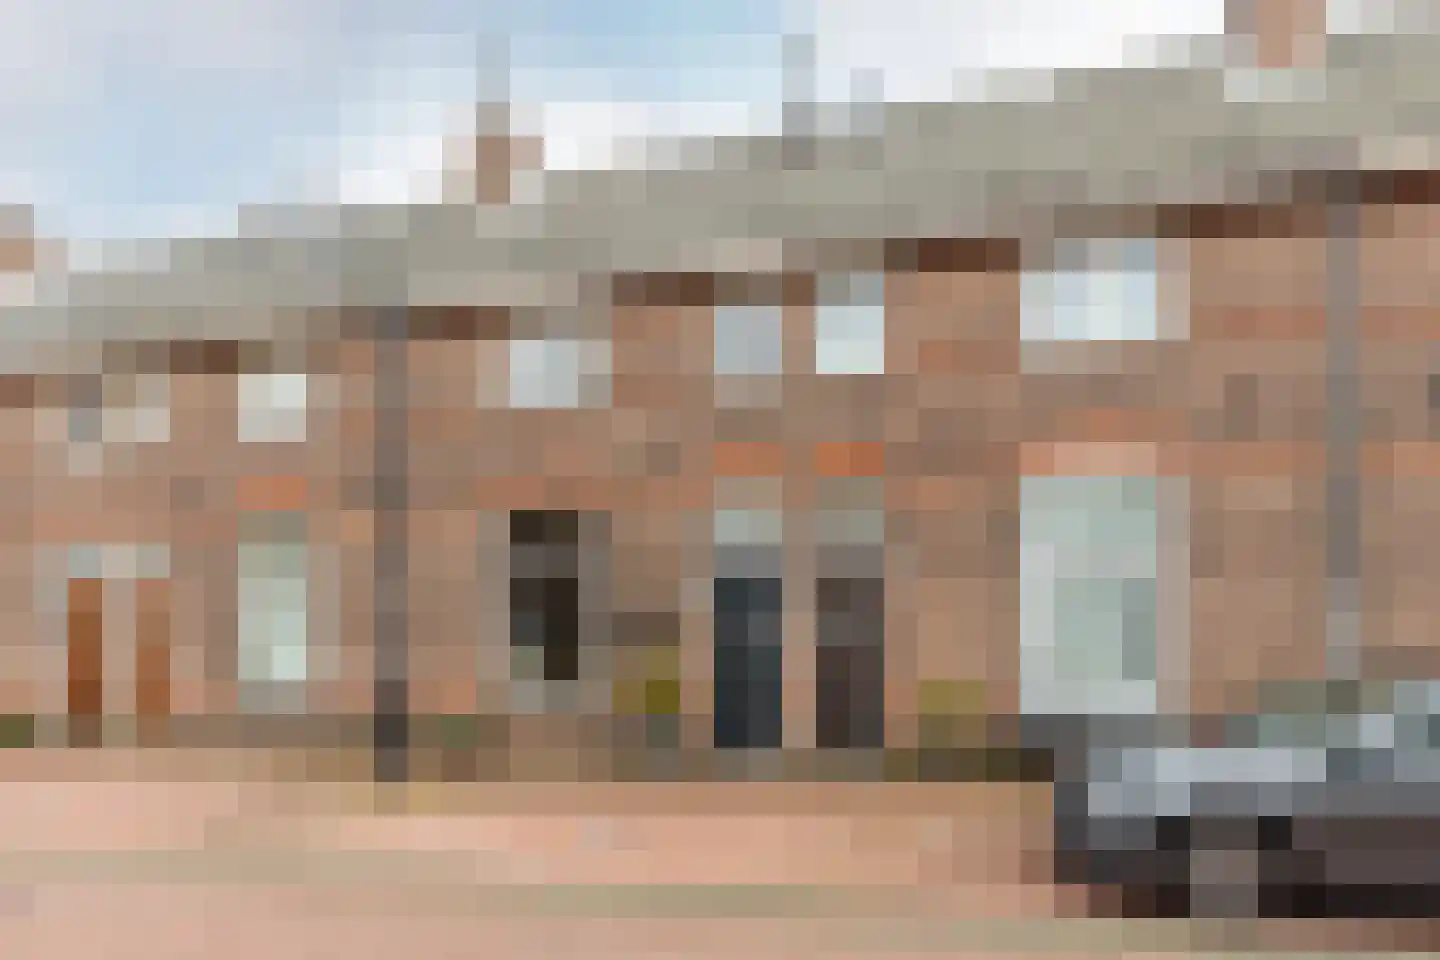
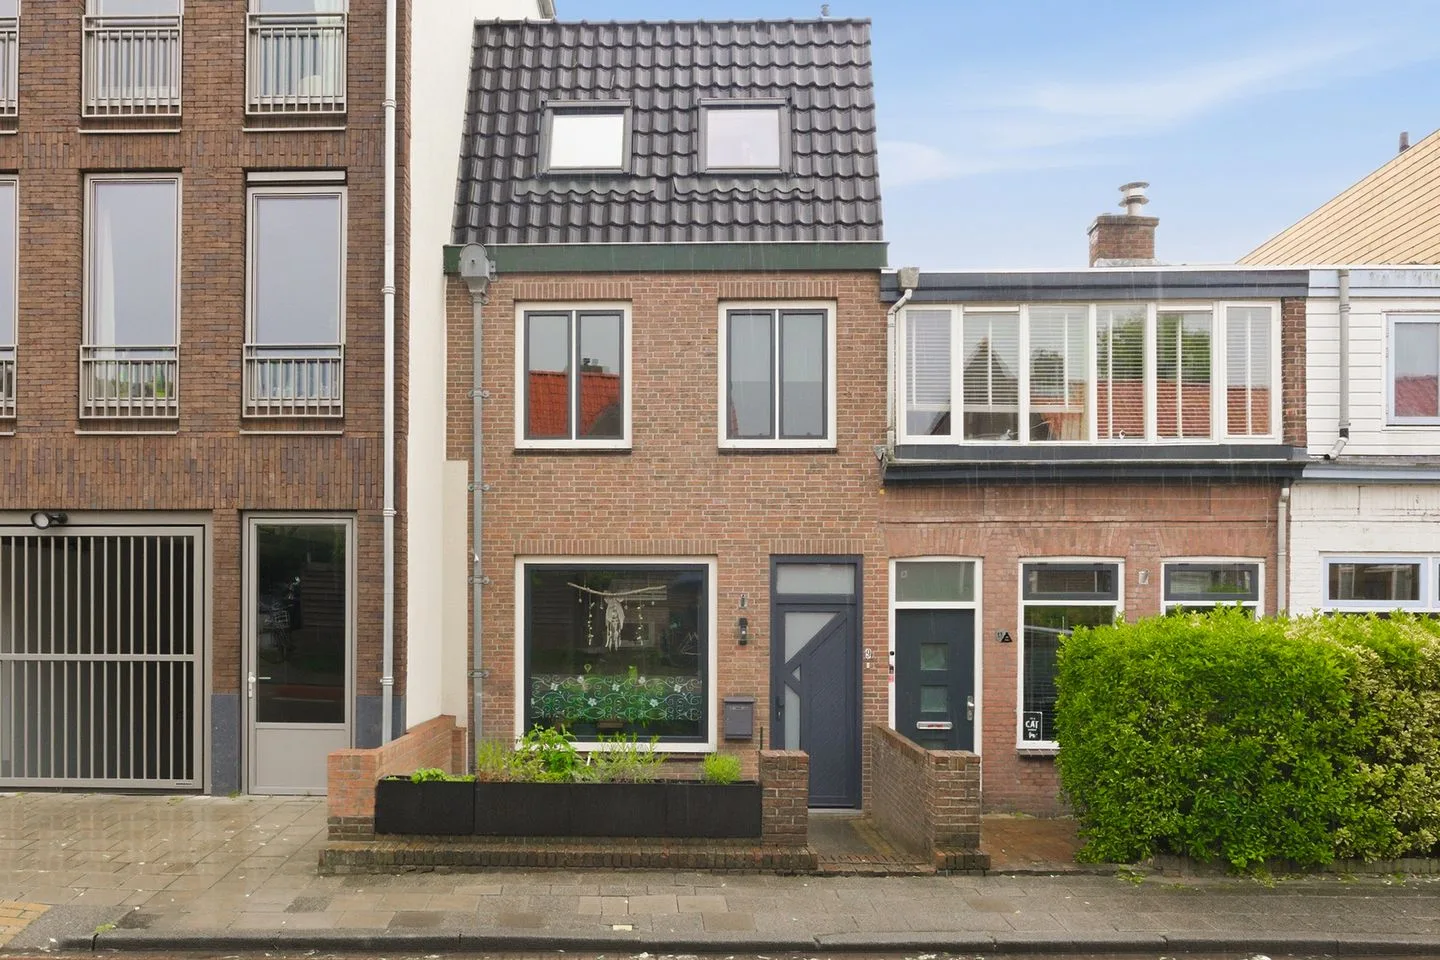
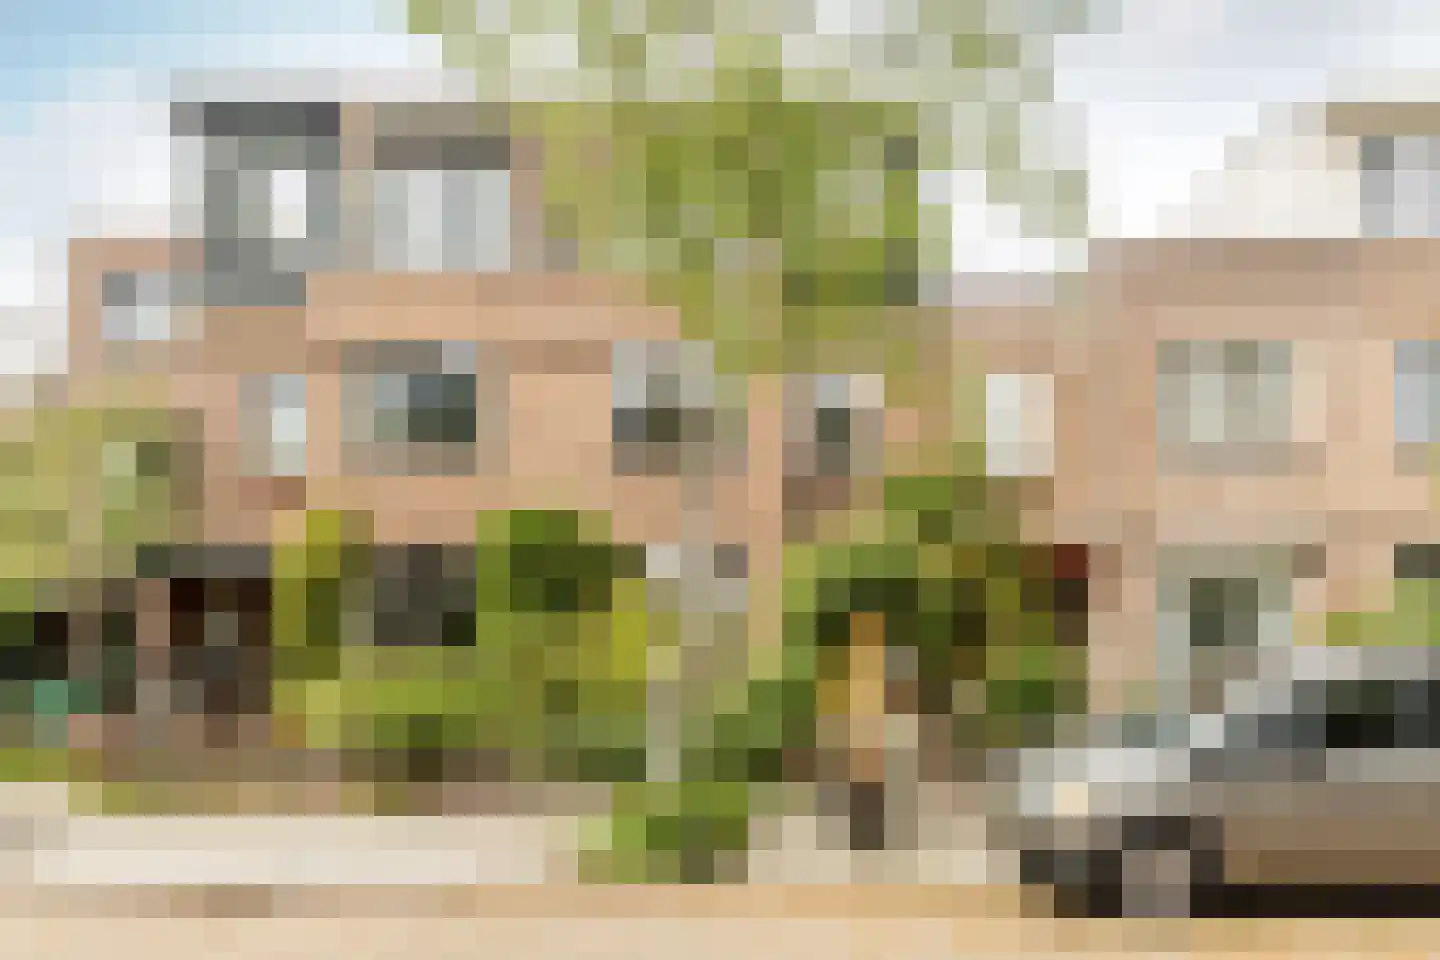
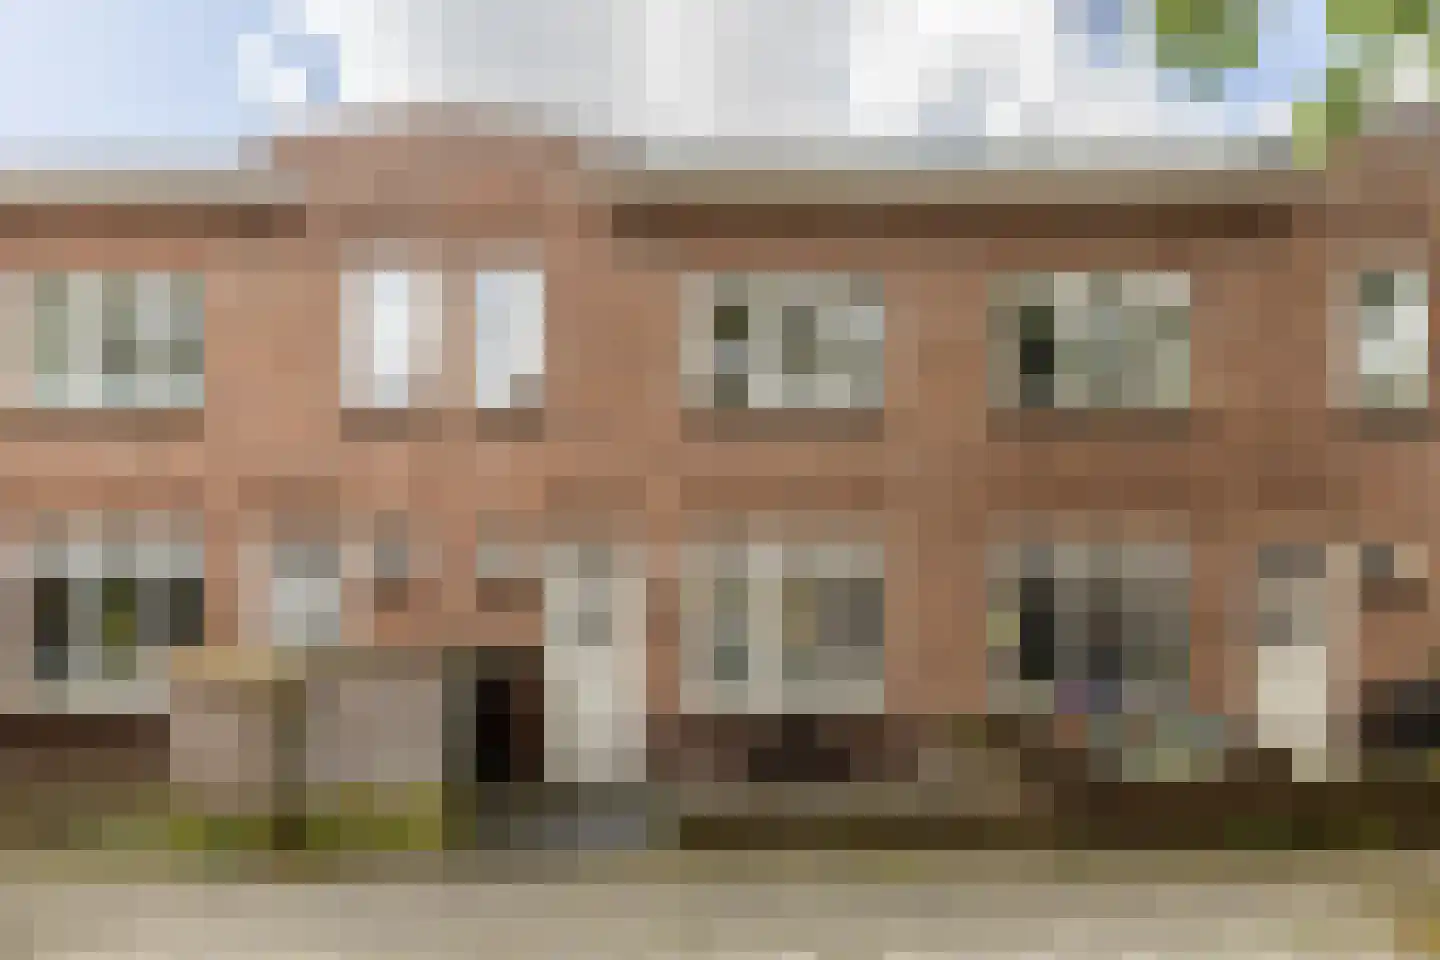
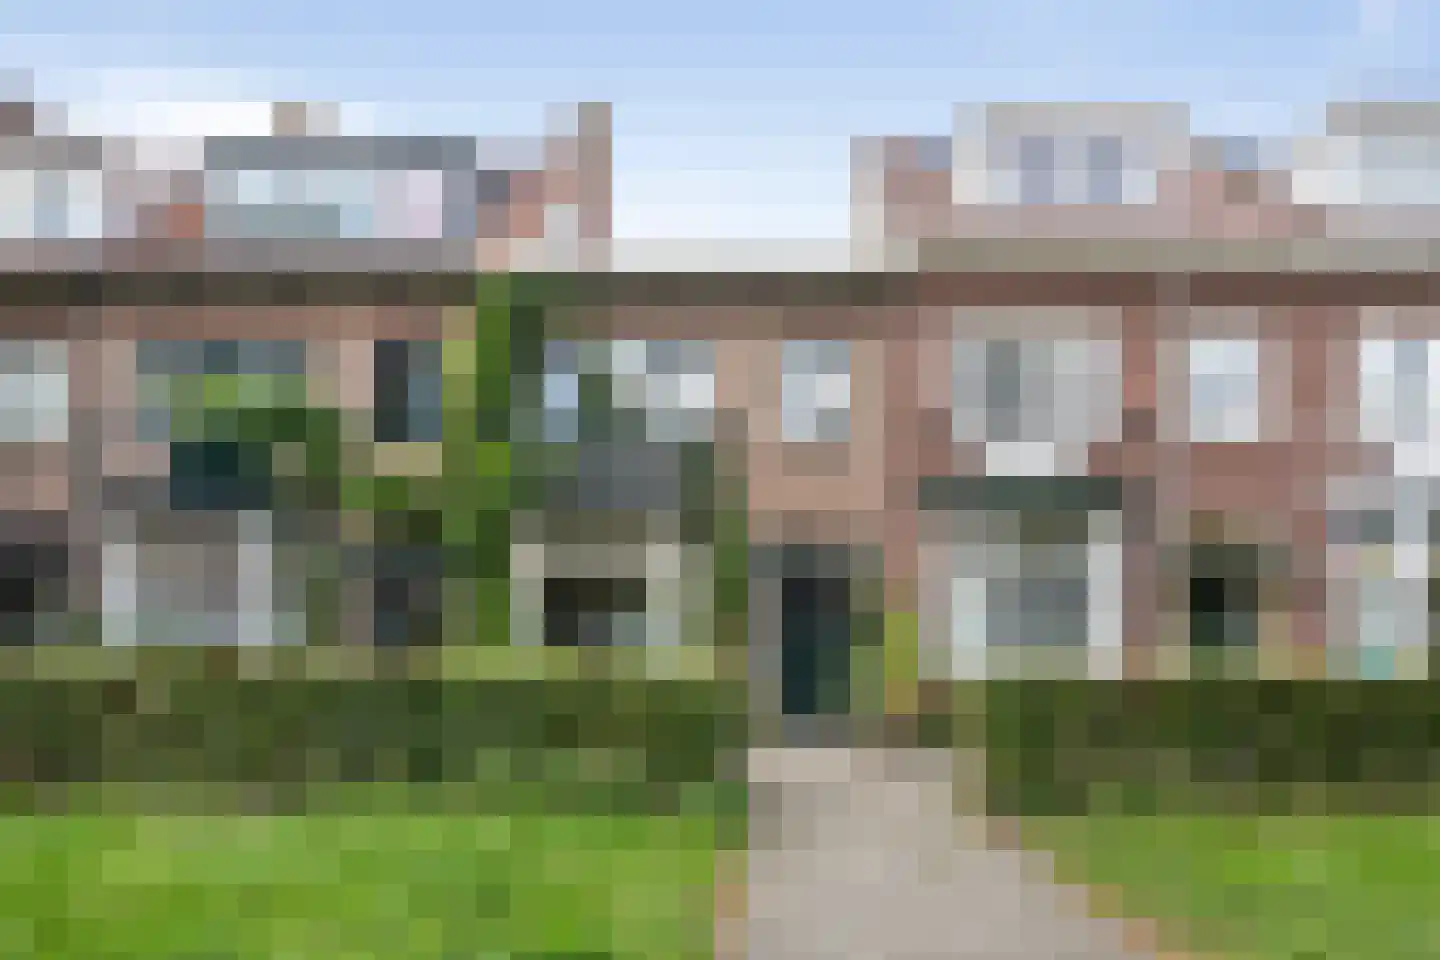
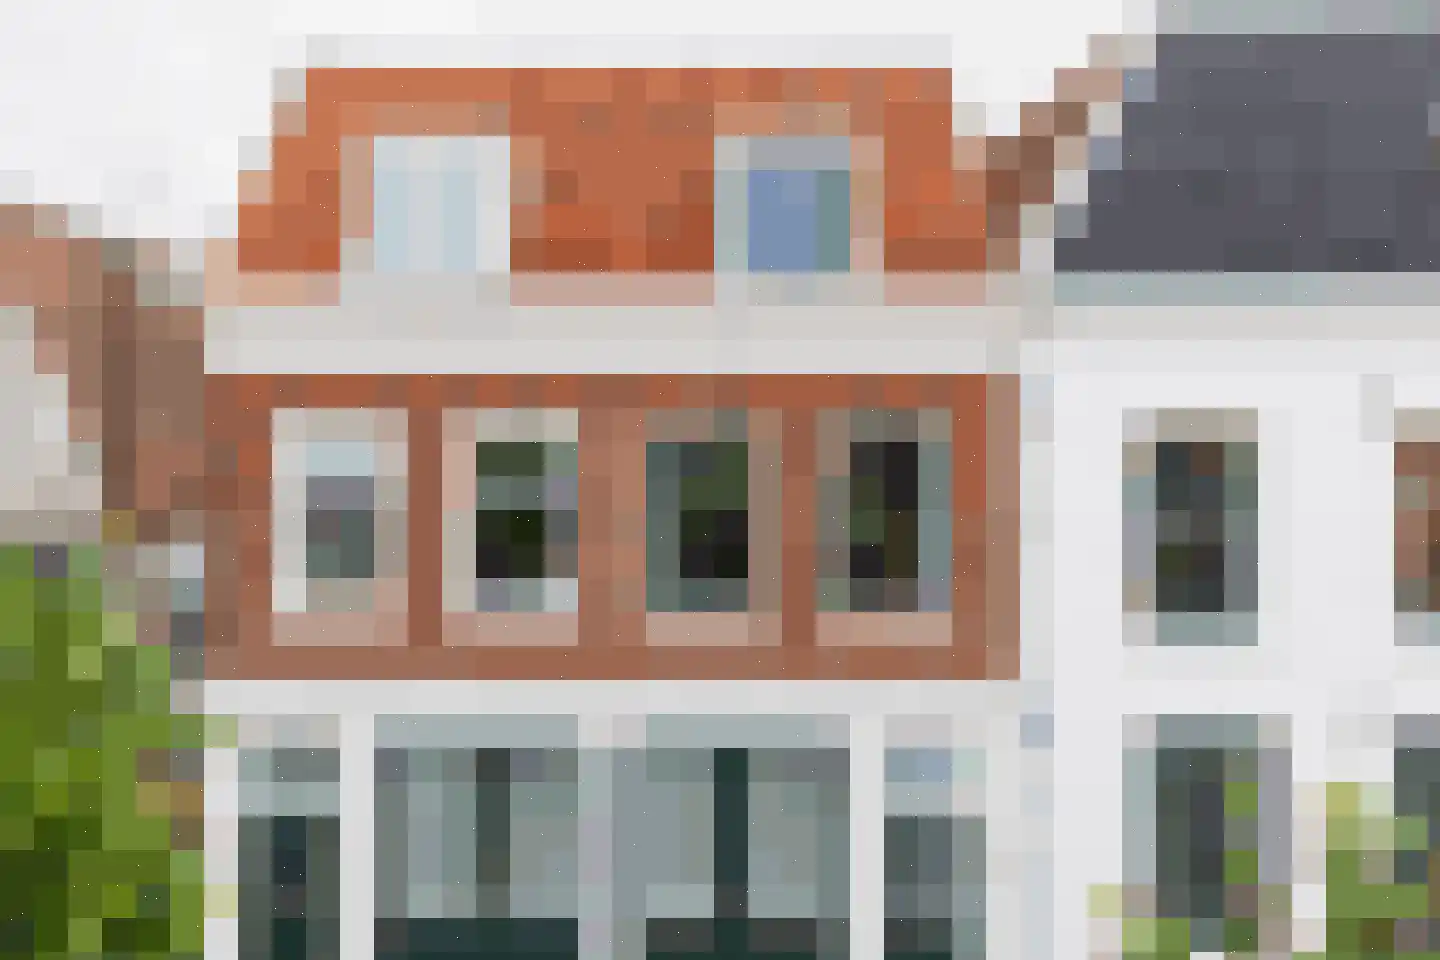
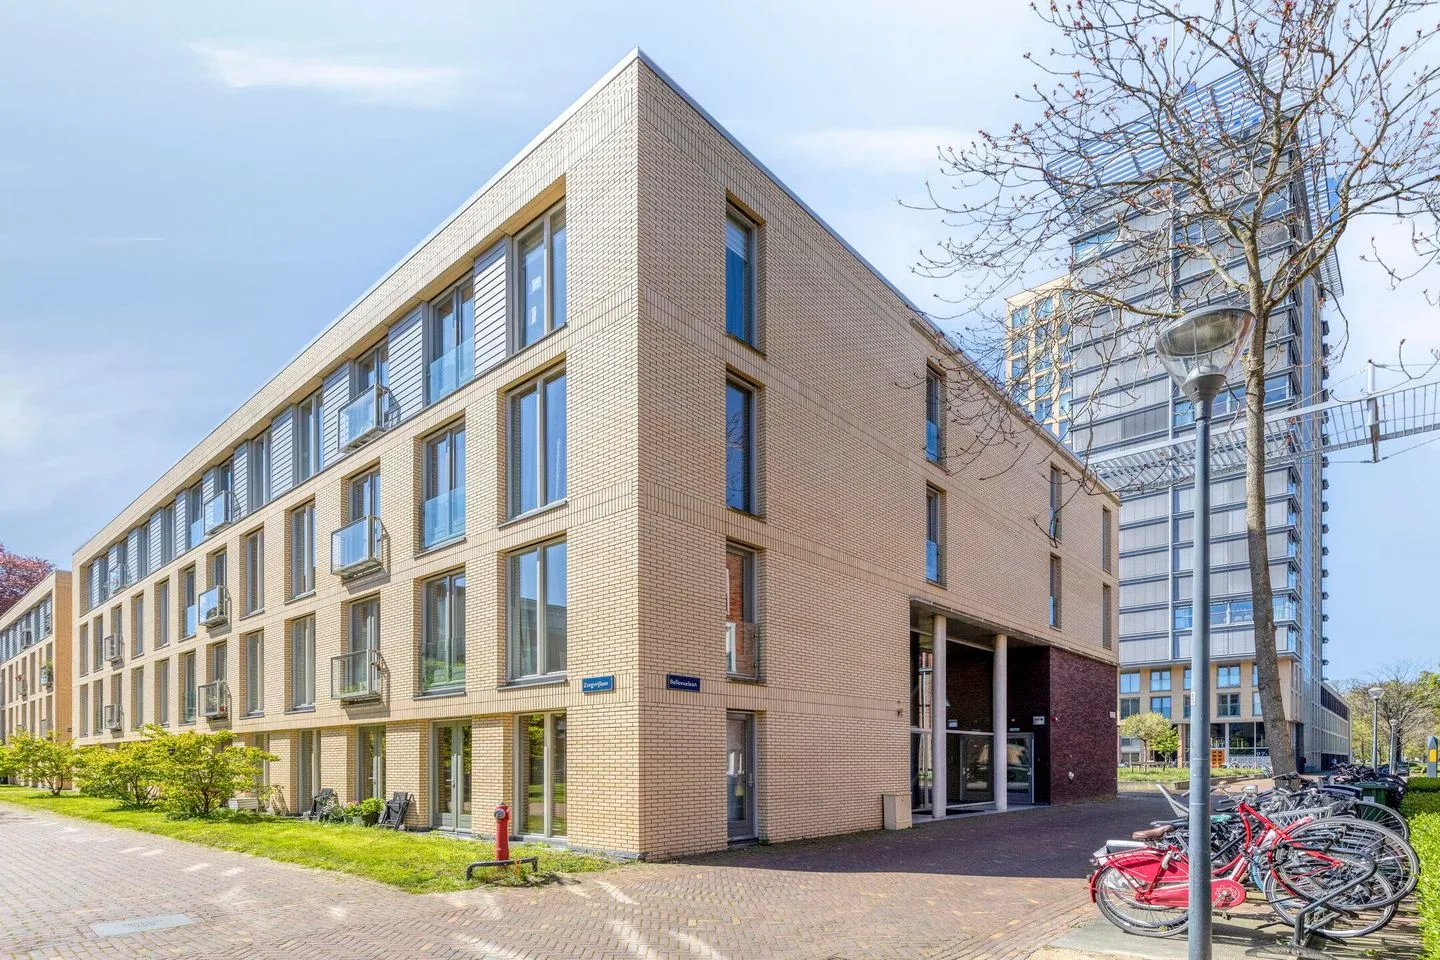
- Available
Harmenjansweg 18
2031WK Haarlem
€ 585.000 k.k.
€ 5.467/m²
- Living area
- 107 m²
- Land area
- 90 m²
- Bedrooms
- 5
Searching in 2.998 houses in Haarlem
Type to search. Use arrow down and arrow up to navigate through results and press Enter to open.
Hidden search suggestions.
View current properties in Haarlem or search targeted on street, postal code and property characteristics.
View the current housing stock in Haarlem and quickly filter by price, living area, rooms and more. There are currently 2.998 houses in this place within our selection. View also 2.031 sold houses in Haarlem for extra insight into the local housing market.
2031WK Haarlem
€ 585.000 k.k.
€ 5.467/m²
2034EZ Haarlem
€ 565.000 k.k.
€ 5.231/m²
2014RC Haarlem
€ 350.000 k.k.
€ 6.250/m²
2011EG Haarlem
€ 600.000 k.k.
€ 5.217/m²
2021ZP Haarlem
€ 895.000 k.k.
€ 8.136/m²
2024JT Haarlem
€ 425.000 k.k.
€ 4.942/m²
2023GL Haarlem
€ 750.000 k.k.
€ 6.098/m²
2012BX Haarlem
€ 415.000 k.k.
€ 6.484/m²
2011MD Haarlem
€ 750.000 k.k.
€ 6.250/m²
2014TK Haarlem
€ 635.000 k.k.
€ 5.880/m²
2023RS Haarlem
€ 700.000 k.k.
€ 5.983/m²
2022CT Haarlem
€ 725.000 k.k.
€ 5.943/m²
2023NN Haarlem
€ 725.000 k.k.
€ 7.880/m²
2012WS Haarlem
€ 595.000 k.k.
€ 7.438/m²
2022BM Haarlem
€ 565.000 k.k.
€ 6.570/m²
2011NT Haarlem
€ 450.000 k.k.
€ 6.081/m²
2011SX Haarlem
€ 800.000 k.k.
2026VL Haarlem
€ 619.000 k.k.
€ 5.952/m²
2014HK Haarlem
€ 595.000 k.k.
€ 3.814/m²
2022BB Haarlem
€ 625.000 k.k.
€ 4.496/m²
2012BX Haarlem
€ 449.500 k.k.
€ 7.750/m²
2022RD Haarlem
€ 775.000 k.k.
€ 6.250/m²
2032MG Haarlem
€ 700.000 k.k.
€ 5.263/m²
2014RG Haarlem
€ 650.000 k.k.
€ 5.462/m²
2021HN Haarlem
€ 325.000 k.k.
€ 6.771/m²
2012AD Haarlem
€ 1.295.000 k.k.
€ 6.888/m²
2021SH Haarlem
€ 520.000 k.k.
€ 5.977/m²
2037GW Haarlem
€ 495.000 k.k.
€ 4.160/m²
Get free quotes from real estate agents with local market knowledge. Compare more than 179 real estate agents in Haarlem.
Selling a home in Haarlem? View the sales-oriented guide sell a house in Haarlem, compare all real estate agents in Haarlem or view the top 10 real estate agents in Haarlem for extra context to your choice.
Real estate agents make sharper offers when they know you're comparing — ask for quotes for sale or purchase.
Practical answers about housing supply, sales and comparing real estate agents in Haarlem.
The costs of a real estate agent in Haarlem depend on commission, setup costs, property presentation and the chosen service. Compare the 179 real estate agents in Haarlem via the real estate agent page and request multiple quotes to compare rates and approach well.
Within our selection, we are currently showing 2.998 houses in Haarlem. View also the sold houses in Haarlem to compare the current offering with recent transactions.
Take into account not only price and living area but also maintenance, energy label, location, outdoor space and sales status. This way you compare houses in Haarlem on more than just the asking price.
A local real estate agent knows the neighborhoods, recent transactions and demand in Haarlem. By comparing 179 real estate agents in the region you get a better insight into prices, sales strategy and expected yield; the top 10 in Haarlem provides a useful starting point.
Yes, when making a sales plan, a valuation in Haarlem is wise. You gain insight into a realistic asking price and can then compare offers from real estate agents specifically.
View current location data on residents, WOZ development, housing stock, energy consumption, business activity and safety in Haarlem. In 2026 were there 168.946 residents. The average WOZ value in 2025 is EUR 505.000.
These figures help to better assess and compare the housing stock in Haarlem with recent sold homes. Orient yourself then on suitable top real estate agents in Haarlem for sales advice in this region.
Residents
168.946
Last year: 2026
Average WOZ
EUR 505.000
Last year: 2025
Average income per person.
EUR 39.300
Source: AllNumbers
Crimes (current year)
9.383
Total registered
| Year | Residents |
|---|---|
| 2022 | 162.898 |
| 2023 | 165.396 |
| 2024 | 167.636 |
| 2025 | 168.743 |
| 2026 | 168.946 |
| Year | Average WOZ |
|---|---|
| 2021 | EUR 380.000 |
| 2022 | EUR 417.000 |
| 2023 | EUR 479.000 |
| 2024 | EUR 483.000 |
| 2025 | EUR 505.000 |
Hoger
45
Praktisch
22
Middelbaar
33
Europa
22.013
Nederland
105.573
Buiten Europa
41.157
Label C
16.311
Label A
16.043
Label F
11.811
Label G
10.233
Label B
8.296
Label E
8.020
Label D
7.483
Label A+++
1.955
Label A++
1.470
Label A+
1.442
Label A++++
138
Label A+++++
16
| Year | Gas (m3) | Electricity (kWh) |
|---|---|---|
| 2020 | 1.080 | 2.390 |
| 2021 | 1.220 | 2.450 |
| 2022 | 960 | 2.280 |
| 2023 | 840 | 2.140 |
| 2024 | 800 | 2.160 |
Hoekwoning
Gas: 1.110 • Electricity: 2.580
Huurwoning
Gas: 710 • Electricity: 1.800
Koopwoning
Gas: 950 • Electricity: 2.430
Appartement
Gas: 670 • Electricity: 1.800
Tussenwoning
Gas: 950 • Electricity: 2.400
Vrijstaande woning
Gas: 1.700 • Electricity: 4.040
Twee-onder-één-kap woning
Gas: 1.480 • Electricity: 3.310
Total number of company establishments: 28.865
| Period | Crimes |
|---|---|
| jan 2025 | 720 |
| jan 2026 | 752 |
| jul 2025 | 814 |
| jun 2025 | 842 |
| mei 2025 | 894 |
| mrt 2025 | 813 |
| nov 2024 | 773 |
| nov 2025 | 709 |
| okt 2024 | 880 |
| okt 2025 | 776 |
| sep 2024 | 777 |
| sep 2025 | 800 |
These figures give an indicative picture of safety trends in the living environment of Haarlem.
Short answers based on current local statistics, handy for a quick comparison of the living environment.
Haarlem telt in 2026 ongeveer 168.946 inwoners.
De gemiddelde WOZ-waarde in Haarlem is in 2025 circa € 505.000.
Het gemiddelde inkomen per inwoner in Haarlem ligt rond € 39.300 per jaar.
Voor het huidige jaar gaat het om ongeveer 9.383 geregistreerde misdrijven. Gebruik deze cijfers als indicatie en vergelijk trends per periode.
In Haarlem komt vooral "Appartementen" veel voor, met ongeveer 46.092 woningen.