- Available
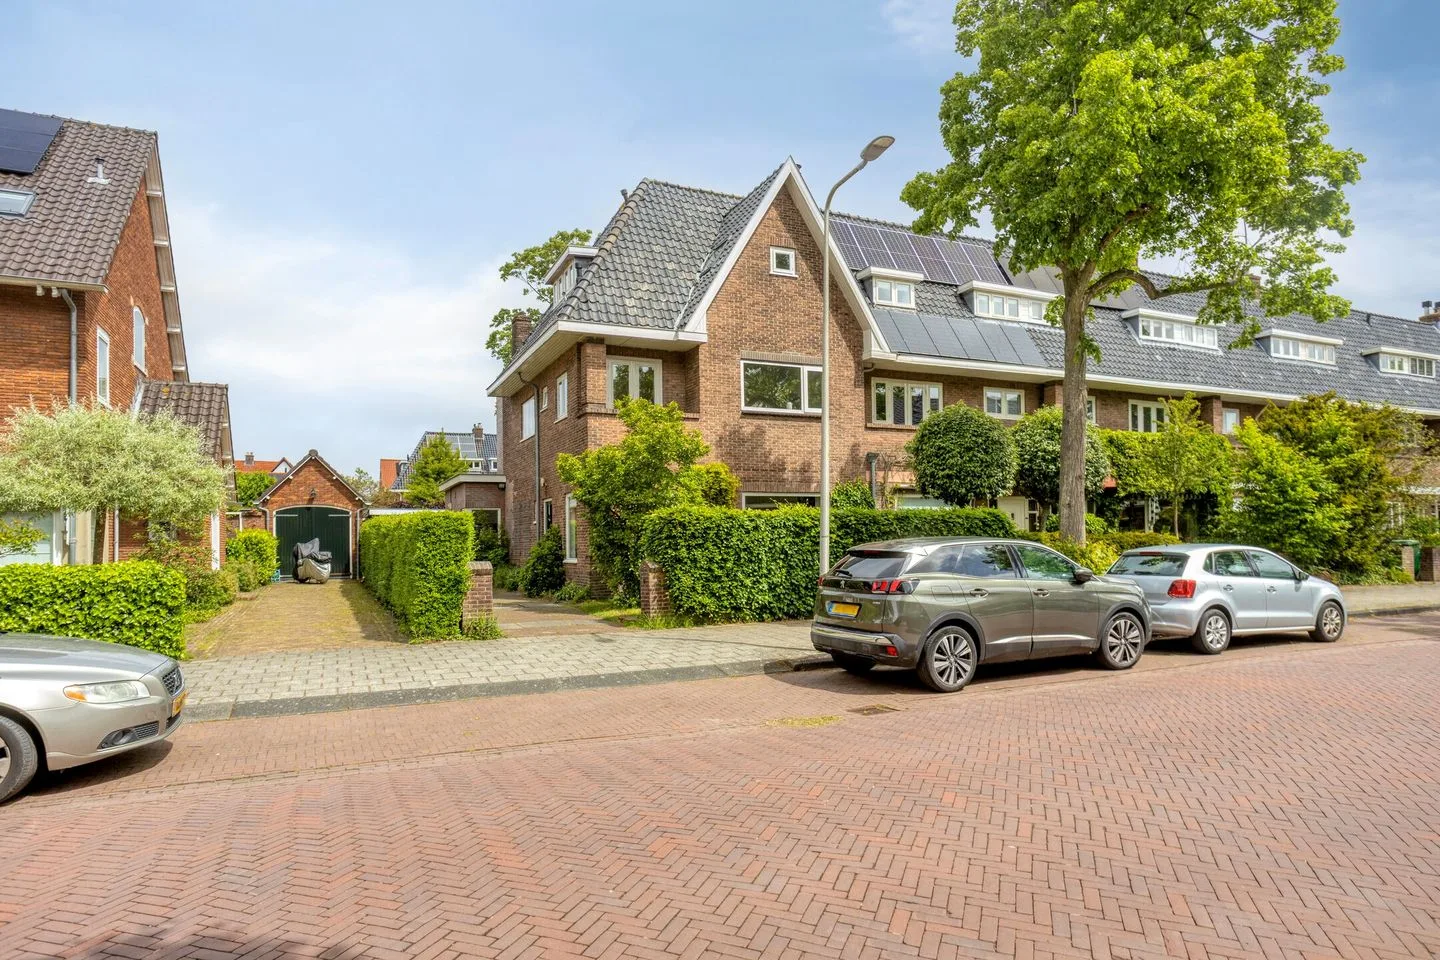
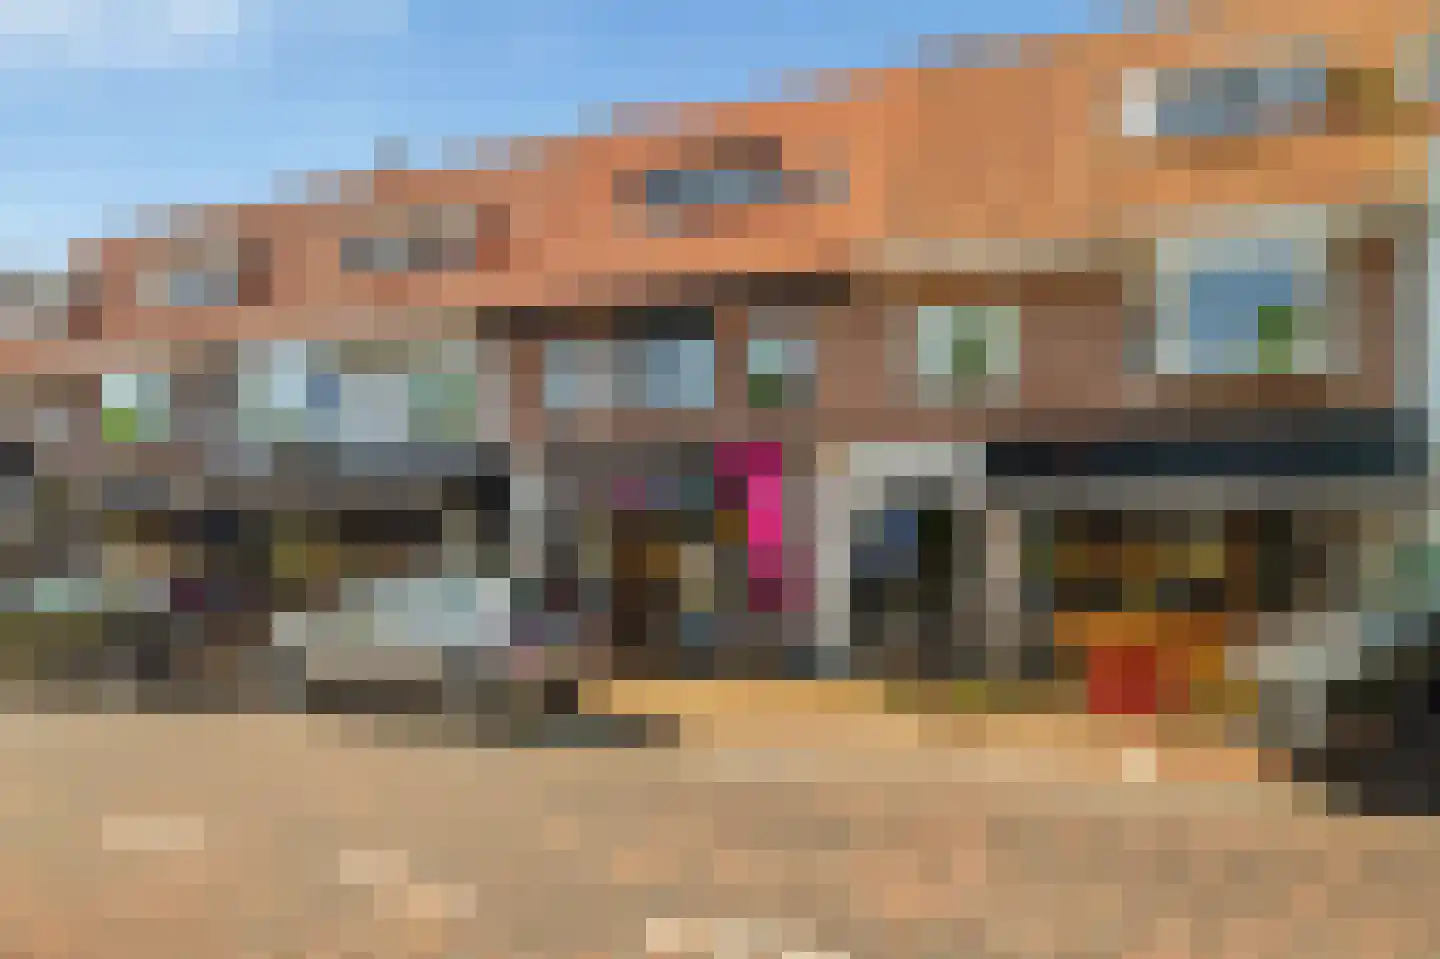
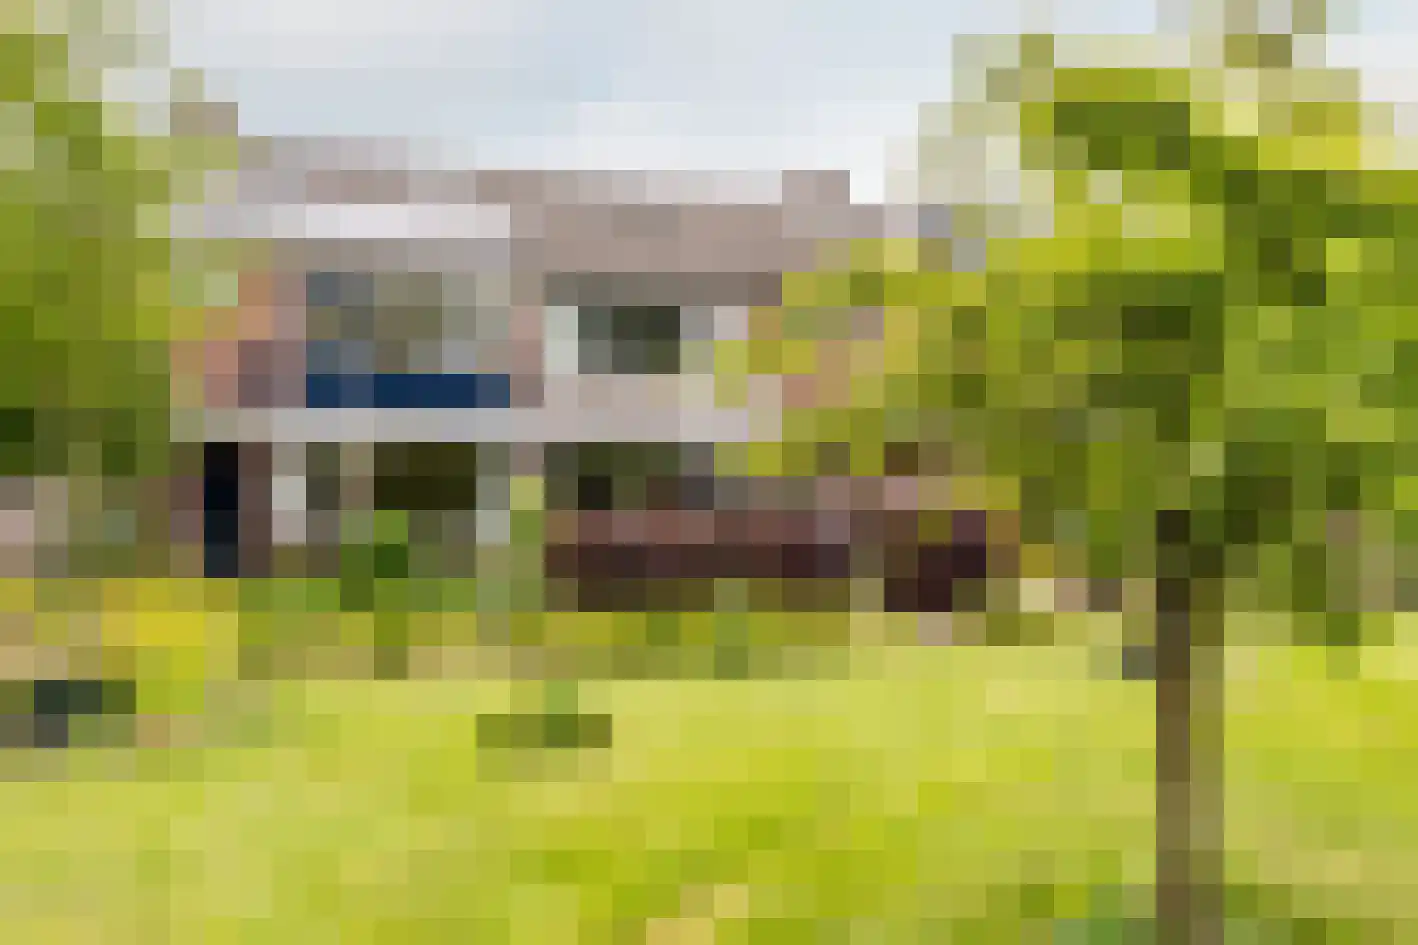
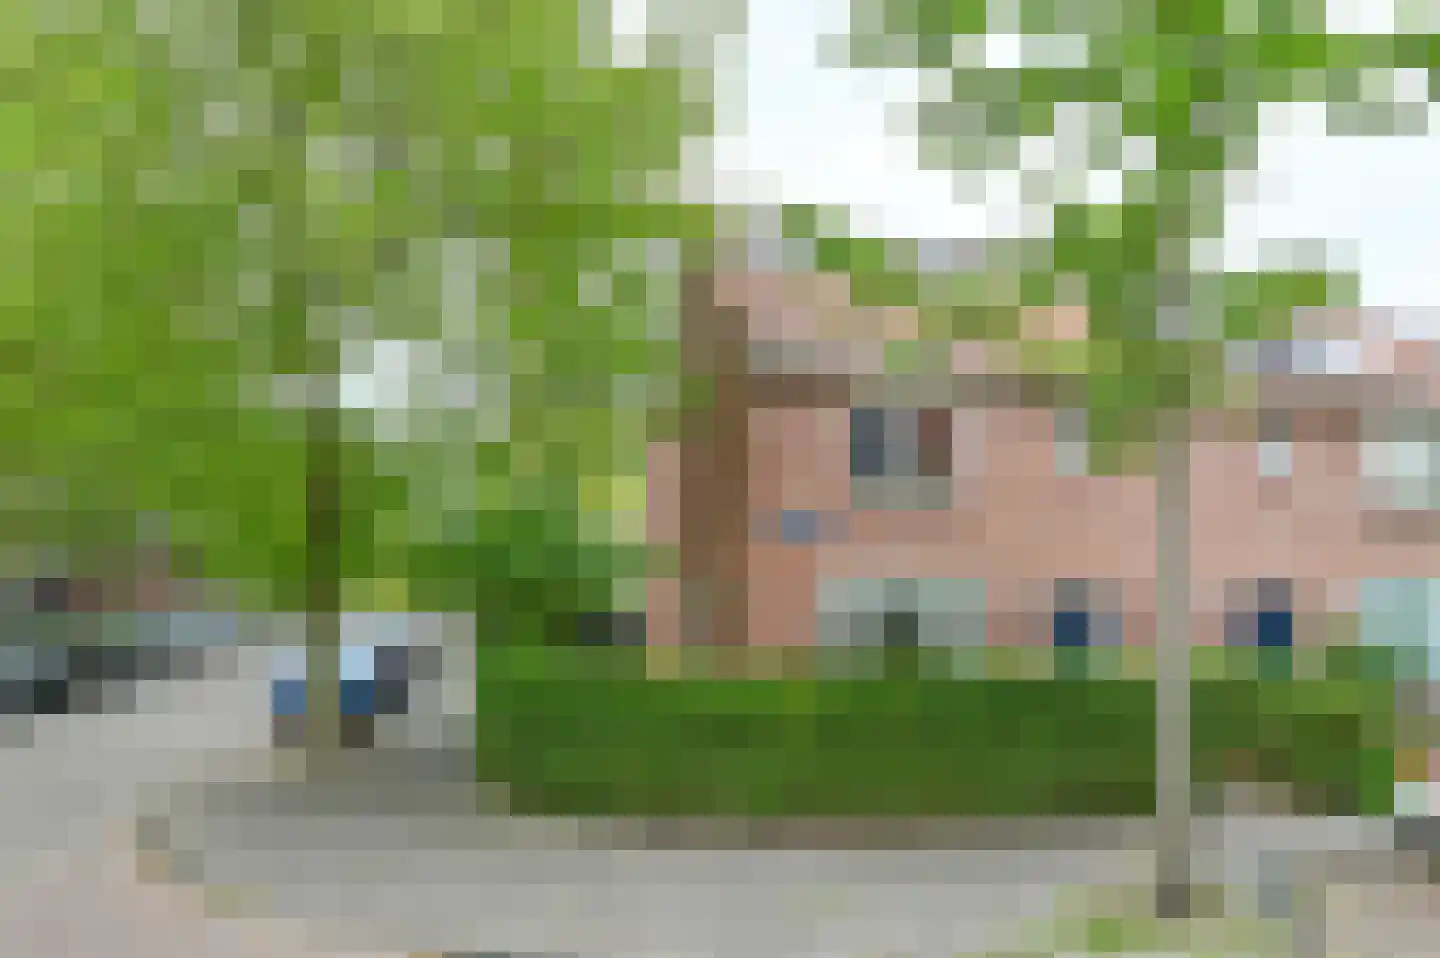
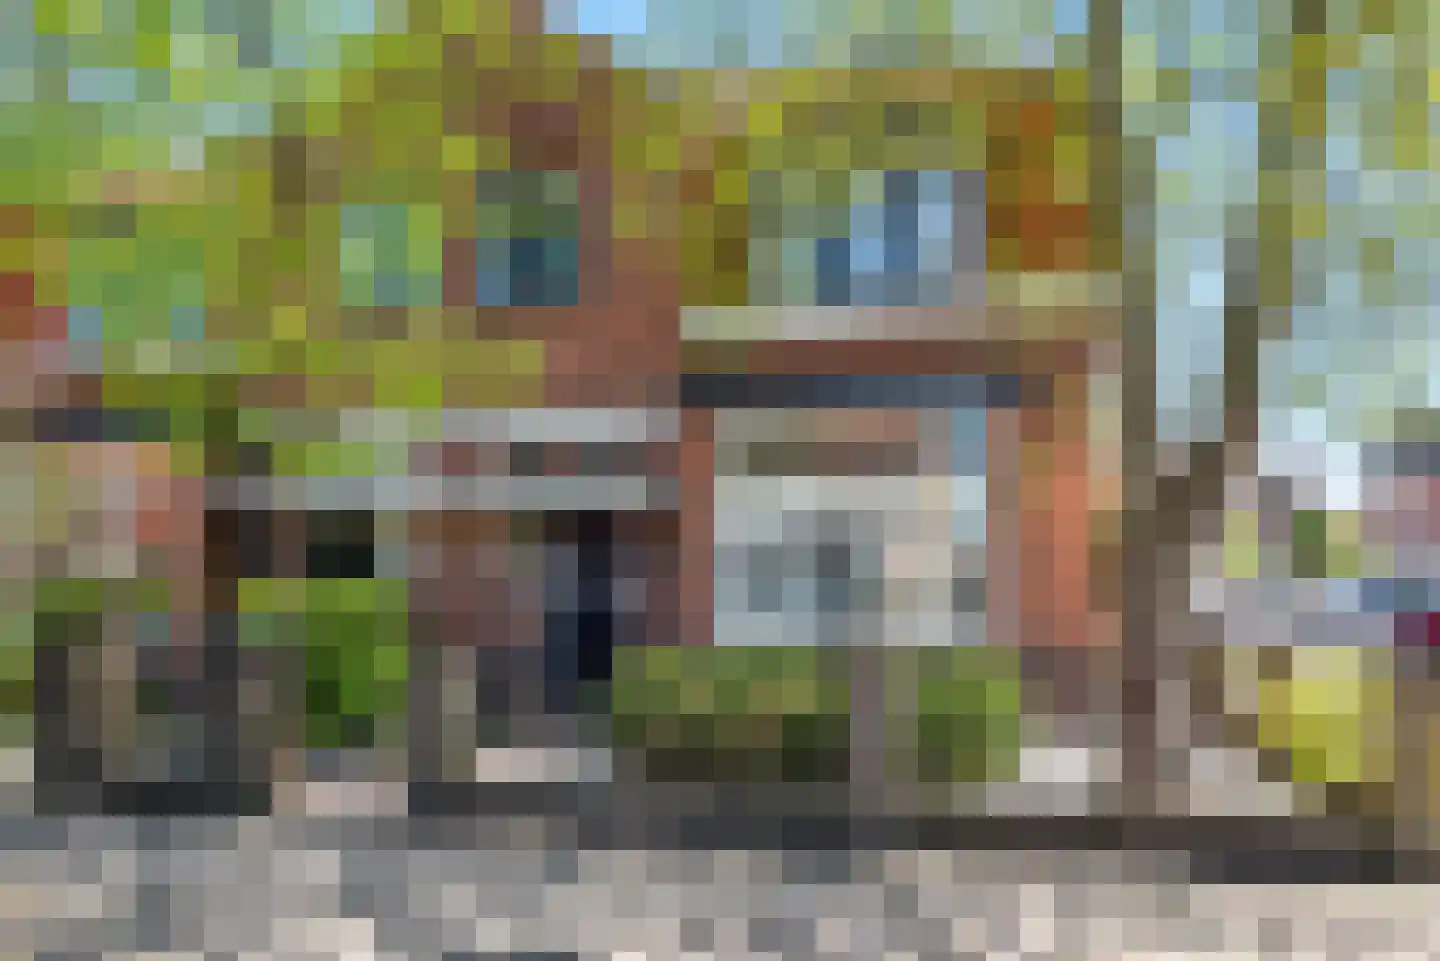
Heemsteedse Dreef 239
2101KG Heemstede
€ 1.695.000 k.k.
€ 8.737/m²
- Living area
- 194 m²
- Land area
- 631 m²
- Bedrooms
- 5
Searching in 411 houses in Heemstede
Type to search. Use arrow down and arrow up to navigate through results and press Enter to open.
Hidden search suggestions.
View current properties in Heemstede or search targeted on street, postal code and property characteristics.
View the current housing stock in Heemstede and quickly filter by price, living area, rooms and more. There are currently 411 houses in this place within our selection. View also 262 sold houses in Heemstede for extra insight into the local housing market.
2101KG Heemstede
€ 1.695.000 k.k.
€ 8.737/m²
2104SP Heemstede
€ 585.000 k.k.
€ 5.132/m²
2105PH Heemstede
€ 1.900 p/m
€ 25/m²
2102BP Heemstede
€ 1.365.000 k.k.
€ 7.541/m²
2106MH Heemstede
€ 1.095.000 k.k.
€ 5.856/m²
2105VH Heemstede
€ 2.195.000 k.k.
€ 10.305/m²
2101GC Heemstede
€ 4.250.000 k.k.
€ 9.259/m²
2105RK Heemstede
€ 527.500 k.k.
€ 6.433/m²
2103VN Heemstede
€ 1.200.000 k.k.
€ 7.143/m²
2103GS Heemstede
€ 1.650.000 k.k.
€ 5.323/m²
2101JH Heemstede
€ 2.000 p/m
€ 31/m²
2105XM Heemstede
€ 375.000 k.k.
€ 5.282/m²
2101ST Heemstede
€ 695.000 k.k.
€ 6.043/m²
2106AM Heemstede
€ 535.000 k.k.
€ 5.944/m²
2105RK Heemstede
€ 519.000 k.k.
€ 7.414/m²
2101SR Heemstede
€ 395.000 k.k.
€ 3.950/m²
2101BX Heemstede
€ 798.000 k.k.
€ 5.700/m²
2106CD Heemstede
€ 1.150.000 k.k.
€ 7.233/m²
2102CZ Heemstede
€ 2.050.000 k.k.
€ 8.577/m²
2102LC Heemstede
€ 745.000 k.k.
€ 6.773/m²
2103AM Heemstede
€ 549.000 k.k.
€ 6.239/m²
2102GS Heemstede
€ 795.000 k.k.
€ 5.445/m²
2101TV Heemstede
€ 667.000 k.k.
€ 6.292/m²
2103VL Heemstede
€ 700.000 k.k.
€ 6.034/m²
2105VN Heemstede
€ 375.000 k.k.
€ 4.032/m²
2102LC Heemstede
€ 750.000 k.k.
€ 6.757/m²
2106BX Heemstede
€ 1.250.000 k.k.
€ 6.906/m²
2102AL Heemstede
€ 1.550.000 k.k.
€ 7.346/m²
Get free quotes from real estate agents with local market knowledge. Compare more than 179 real estate agents in Heemstede.
Selling a home in Heemstede? View the sales-oriented guide sell a house in Heemstede, compare all real estate agents in Heemstede or view the top 10 real estate agents in Heemstede for extra context to your choice.
Real estate agents make sharper offers when they know you're comparing — ask for quotes for sale or purchase.
Practical answers about housing supply, sales and comparing real estate agents in Heemstede.
The costs of a real estate agent in Heemstede depend on commission, setup costs, property presentation and the chosen service. Compare the 179 real estate agents in Heemstede via the real estate agent page and request multiple quotes to compare rates and approach well.
Within our selection, we are currently showing 411 houses in Heemstede. View also the sold houses in Heemstede to compare the current offering with recent transactions.
Take into account not only price and living area but also maintenance, energy label, location, outdoor space and sales status. This way you compare houses in Heemstede on more than just the asking price.
A local real estate agent knows the neighborhoods, recent transactions and demand in Heemstede. By comparing 179 real estate agents in the region you get a better insight into prices, sales strategy and expected yield; the top 10 in Heemstede provides a useful starting point.
Yes, when making a sales plan, a valuation in Heemstede is wise. You gain insight into a realistic asking price and can then compare offers from real estate agents specifically.
View current location data on residents, WOZ development, housing stock, energy consumption, business activity and safety in Heemstede. In 2026 were there 27.557 residents. The average WOZ value in 2025 is EUR 680.000.
These figures help to better assess and compare the housing stock in Heemstede with recent sold homes. Orient yourself then on suitable top real estate agents in Heemstede for sales advice in this region.
Residents
27.557
Last year: 2026
Average WOZ
EUR 680.000
Last year: 2025
Average income per person.
EUR 49.400
Source: AllNumbers
Crimes (current year)
1.071
Total registered
| Year | Residents |
|---|---|
| 2022 | 27.557 |
| 2023 | 27.778 |
| 2024 | 27.593 |
| 2025 | 27.638 |
| 2026 | 27.557 |
| Year | Average WOZ |
|---|---|
| 2021 | EUR 548.000 |
| 2022 | EUR 593.000 |
| 2023 | EUR 673.000 |
| 2024 | EUR 657.000 |
| 2025 | EUR 680.000 |
Hoger
55
Praktisch
16
Middelbaar
30
Europa
2.771
Nederland
20.631
Buiten Europa
4.236
Label C
2.961
Label A
2.291
Label G
2.026
Label F
1.719
Label E
1.508
Label D
1.308
Label B
1.165
Label A+
132
Label A+++
106
Label A++
83
Label A++++
7
Label A+++++
1
| Year | Gas (m3) | Electricity (kWh) |
|---|---|---|
| 2020 | 1.440 | 2.930 |
| 2021 | 1.640 | 3.000 |
| 2022 | 1.270 | 2.780 |
| 2023 | 1.100 | 2.600 |
| 2024 | 1.050 | 2.660 |
Hoekwoning
Gas: 1.350 • Electricity: 3.010
Huurwoning
Gas: 740 • Electricity: 1.800
Koopwoning
Gas: 1.280 • Electricity: 3.020
Appartement
Gas: 710 • Electricity: 1.800
Tussenwoning
Gas: 1.090 • Electricity: 2.690
Vrijstaande woning
Gas: 2.190 • Electricity: 4.680
Twee-onder-één-kap woning
Gas: 1.640 • Electricity: 3.650
Total number of company establishments: 4.670
| Period | Crimes |
|---|---|
| jan 2025 | 99 |
| jan 2026 | 84 |
| jul 2025 | 92 |
| jun 2025 | 72 |
| mei 2025 | 85 |
| mrt 2025 | 103 |
| nov 2024 | 124 |
| nov 2025 | 69 |
| okt 2024 | 115 |
| okt 2025 | 102 |
| sep 2024 | 132 |
| sep 2025 | 94 |
These figures give an indicative picture of safety trends in the living environment of Heemstede.
Short answers based on current local statistics, handy for a quick comparison of the living environment.
Heemstede telt in 2026 ongeveer 27.557 inwoners.
De gemiddelde WOZ-waarde in Heemstede is in 2025 circa € 680.000.
Het gemiddelde inkomen per inwoner in Heemstede ligt rond € 49.400 per jaar.
Voor het huidige jaar gaat het om ongeveer 1.071 geregistreerde misdrijven. Gebruik deze cijfers als indicatie en vergelijk trends per periode.
In Heemstede komt vooral "Tussenwoningen" veel voor, met ongeveer 4.536 woningen.