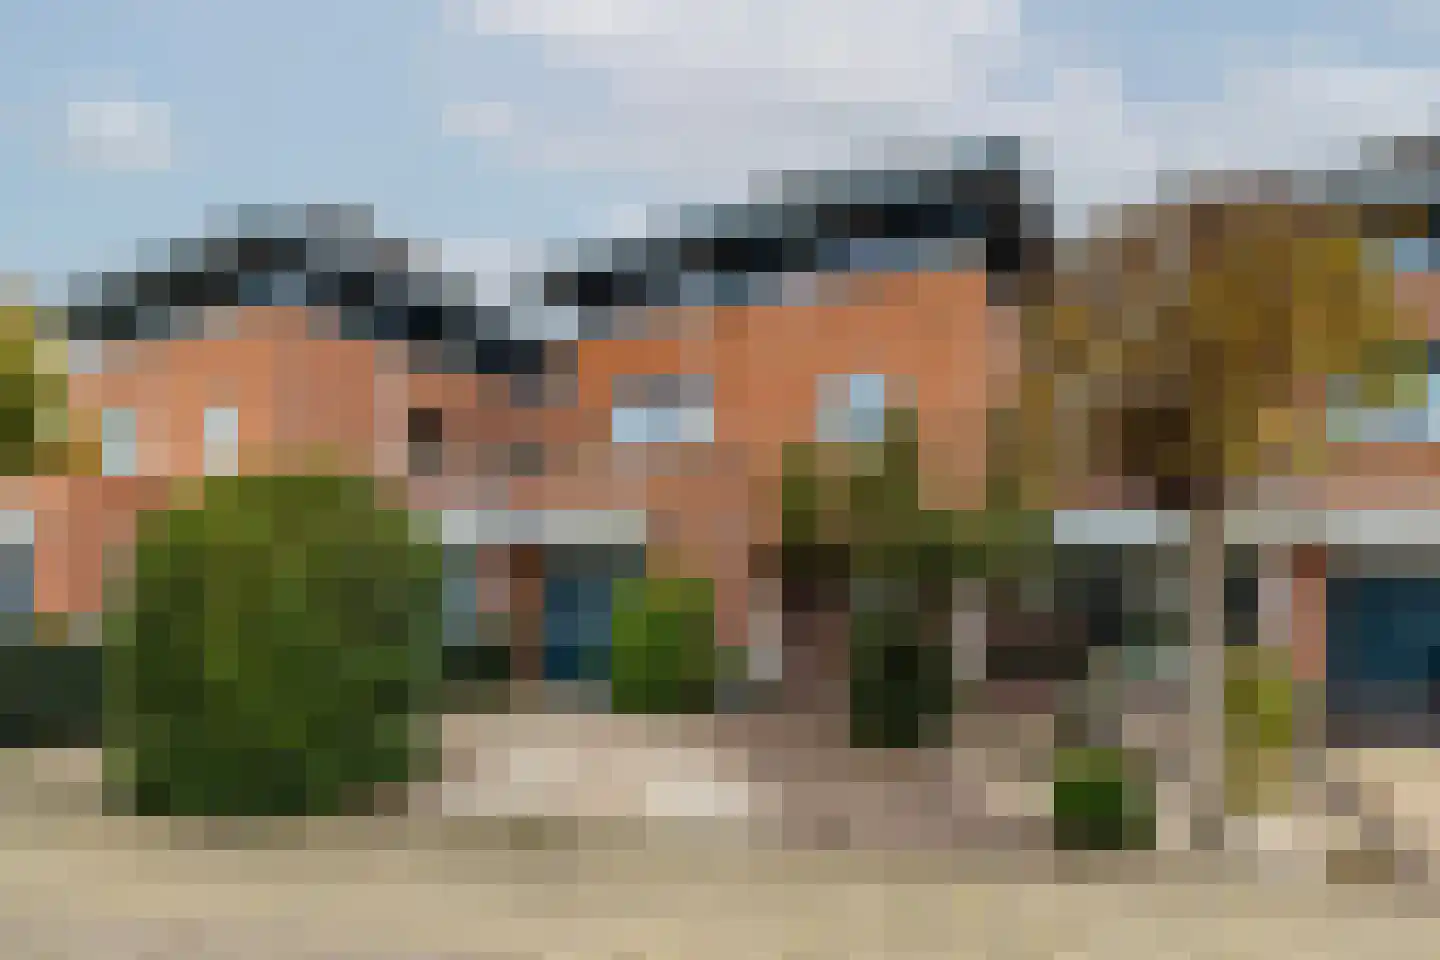
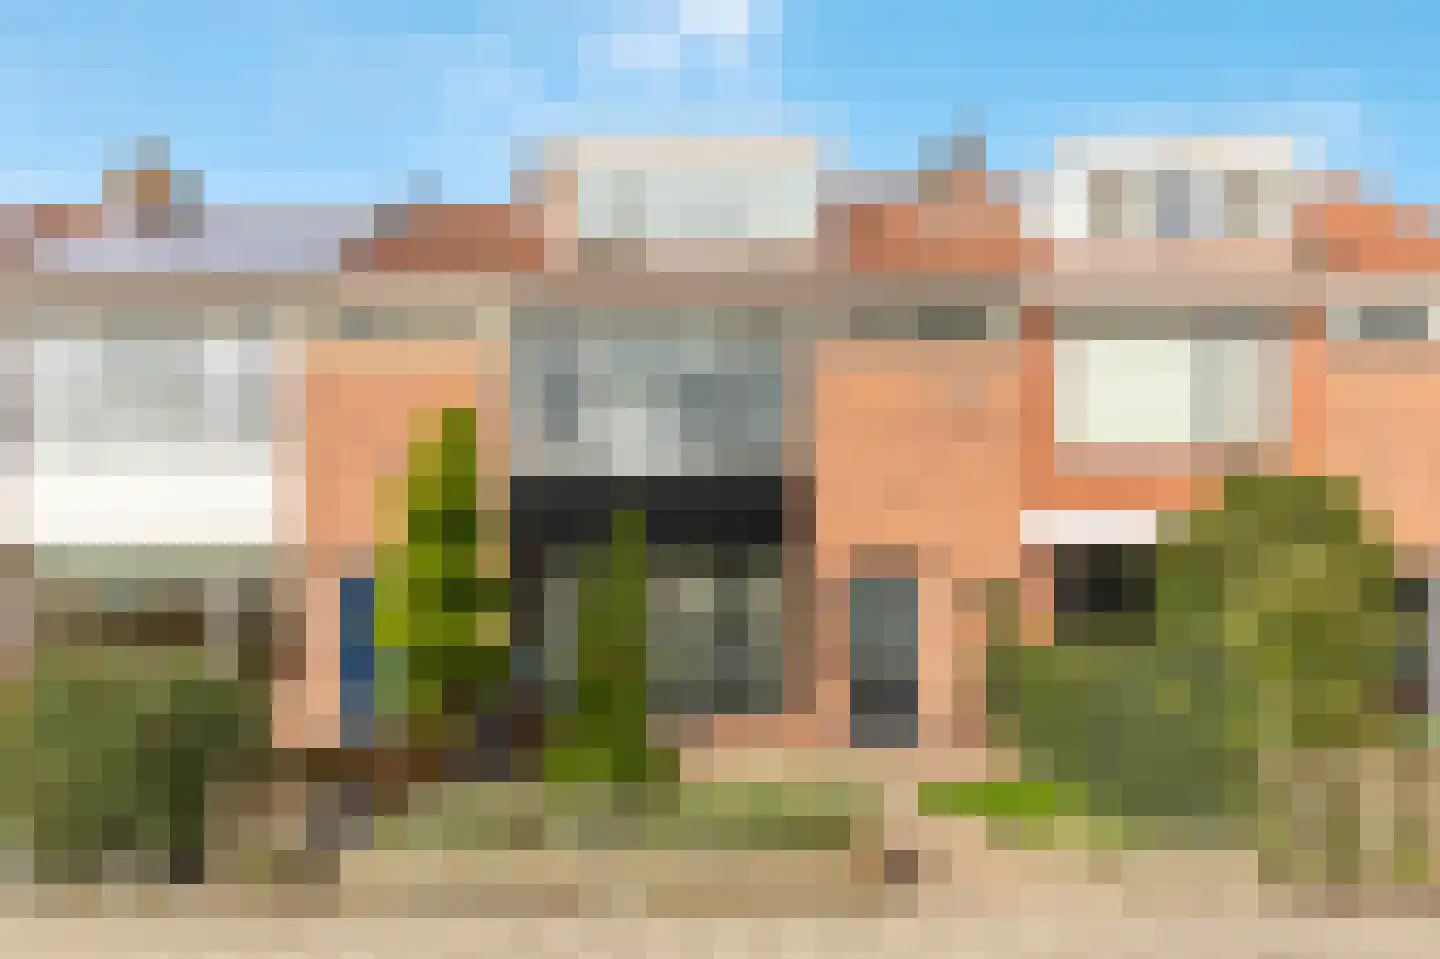
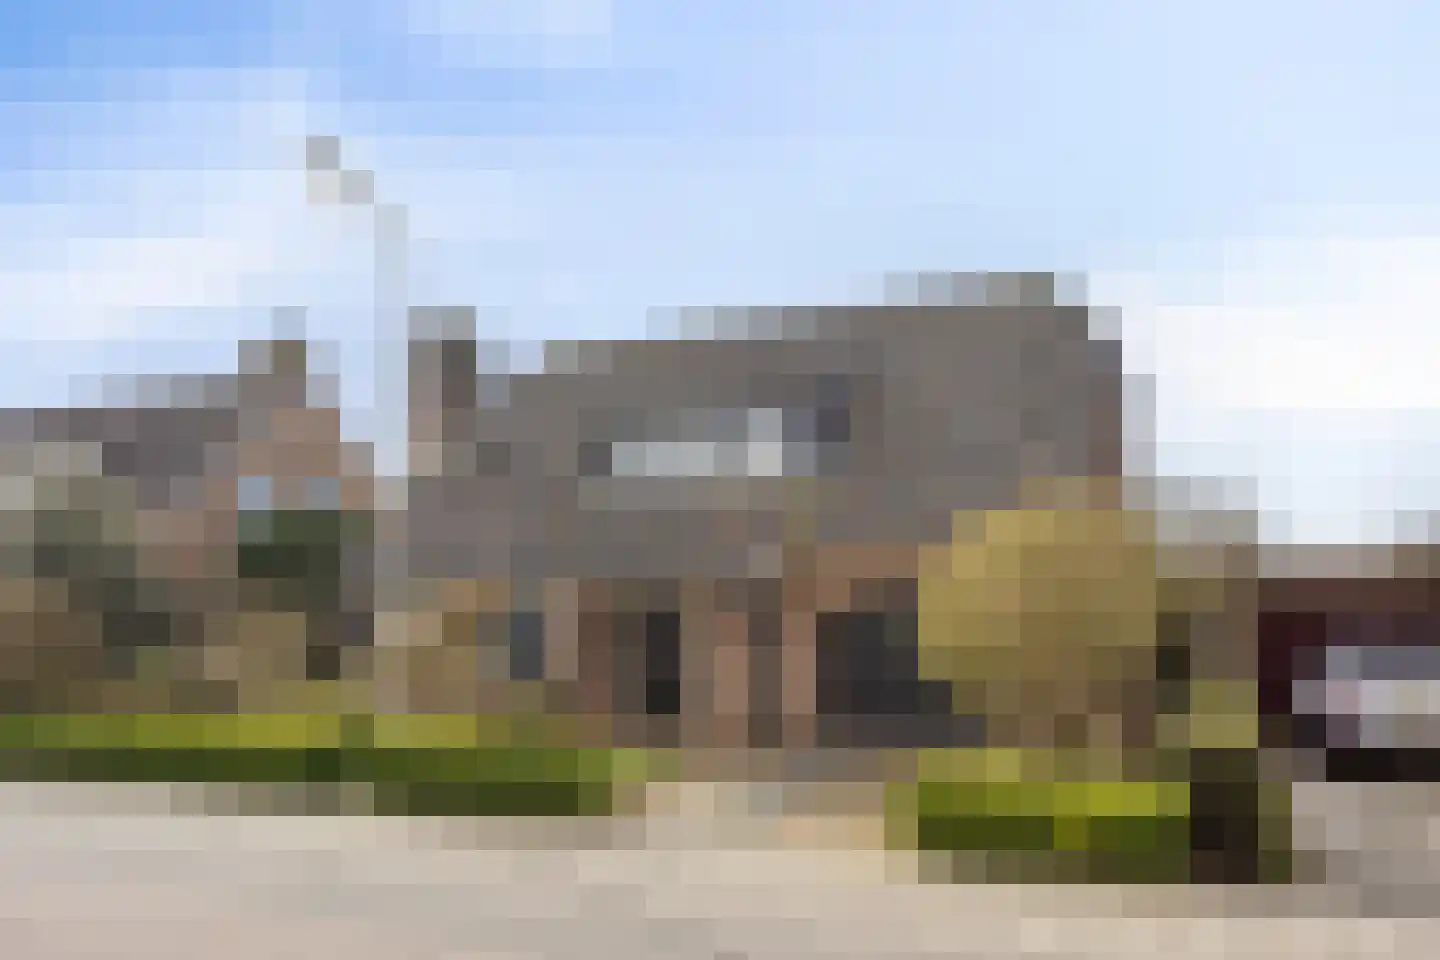
Houses sold in Heerjansdam

View 34 sold houses in Heerjansdam

Connected to: Vastgoed Nederland NVM Makelaars

On this page you will find recently sold homes in Heerjansdam. Use this overview to better estimate selling prices, popular neighborhoods, and the local housing supply before you choose a real estate agent. Also view the current housing supply with 42 houses in Heerjansdam.

Selection

Search and filter homes

Set your preferences and discover homes that suit you.

Total supply 241.421
Filters

Set price, area and other characteristics. Adjust a filter or click on Show homes. Location changes directly above.

Reset filters

You search for

  • Place Heerjansdam
  • Status Sold

Huis verkopen in Heerjansdam? Vergelijk verkoopmakelaars

Bekijk recente verkopen en ontvang gratis offertes van lokale verkoopmakelaars in Heerjansdam.

Free request a quote

  • Quotes in Heerjansdam
  • Non-binding
  • Personal
  • Gratis tarieven vergelijken

Recent verkocht in Heerjansdam? Lees de verkoopgerichte gids huis verkopen in Heerjansdam, vergelijk verkoopmakelaars in Heerjansdam of bekijk de beste verkoopmakelaars in Heerjansdam voor referentie bij jouw keuze.

Vergelijk meerdere offertes

Makelaars maken scherpere voorstellen als ze weten dat je vergelijkt — vraag offertes aan voor verkoop of aankoop.

Frequently asked questions about sold homes in Heerjansdam

Short answers about housing prices, sold homes and comparing real estate agents in Heerjansdam.

Residential and neighborhood statistics in Heerjansdam

View current location data on residents, WOZ development, housing stock, energy consumption, business activity and safety in Heerjansdam. In 2025 were there 3.790 residents. The average WOZ value in 2025 is EUR 432.846.

These figures help to better assess and compare the housing stock in Heerjansdam with recent sold homes. Orient yourself then on suitable top real estate agents in Heerjansdam for sales advice in this region.

Residents

3.790

Last year: 2025

Average WOZ

EUR 432.846

Last year: 2025

Average income per person.

EUR 32.774

Source: AllNumbers

Crimes (current year)

72

Total registered

Demographics and WOZ development

Inhabitants per year

Inhabitants per year in Heerjansdam
Year Residents
2021 3.805
2022 3.820
2023 3.825
2024 3.820
2025 3.790

Annual WOZ value

WOZ value per year in Heerjansdam
Year Average WOZ
2021 EUR 309.341
2022 EUR 330.364
2023 EUR 386.745
2024 EUR 404.387
2025 EUR 432.846

Composition of residents

Age build-up

65+: 880 0-15: 530 15-25: 450 25-45: 820 45-65: 1.115

Education level

Hoger

760

Praktisch

780

Middelbaar

1.300

Origin of residents (2025)

Europa

155

Nederland

3.375

Buiten Europa

255

Housing stock and construction periods

Types of homes

Hoekwoningen 360
Appartementen 308
Tussenwoningen 681
Vrijstaande woningen 274
Twee-onder-één-kap woningen 144

Construction period of buildings

Voor 1700 2
1700 tot 1900 90
1900 tot 1925 9
1925 tot 1950 129
1950 tot 1970 630
1970 tot 1980 244
1980 tot 1990 91
1990 tot 2000 144
2000 tot 2010 119
2010 tot 2020 94
2020 en later 51

Energy and sustainability

Energy label distribution

Label A

506

Label C

333

Label B

229

Label E

191

Label D

152

Label F

131

Label G

117

Label A+

70

Label A++++

19

Label A+++

9

Label A++

3

Label A+++++

0

Average energy consumption per year

Average energy consumption per year in Heerjansdam
Year Gas (m3) Electricity (kWh)
2020 1.258 2.960
2021 1.401 3.059
2022 1.041 2.824
2023 888 2.609
2024 873 2.624

Consumption per house type

Hoekwoning

Gas: 989 • Electricity: 2.727

Huurwoning

Gas: 703 • Electricity: 1.862

Koopwoning

Gas: 1.006 • Electricity: 3.030

Appartement

Gas: 511 • Electricity: 1.648

Tussenwoning

Gas: 819 • Electricity: 2.426

Vrijstaande woning

Gas: 1.478 • Electricity: 3.997

Twee-onder-één-kap woning

Gas: 1.066 • Electricity: 3.314

Business activity in Heerjansdam (2025)

Handel en HORECA 75
Nijverheid en energie 85
Zakelijke dienstverlening 125
Overheid, onderwijs en zorg 70
Landbouw, bosbouw en visserij 15
Vervoer, informatie en communicatie 35
Financiele diensten en onroerendgoed 50
Cultuur, recreatie en overige diensten 45

Total number of company establishments: 500

Recent crime statistics

Recent crime statistics in Heerjansdam
Period Crimes
jan 2025 8
jan 2026 6
jul 2025 8
jun 2025 3
mei 2025 6
mrt 2025 3
nov 2024 1
nov 2025 4
okt 2024 3
okt 2025 6
sep 2024 7
sep 2025 10

These figures give an indicative picture of safety trends in the living environment of Heerjansdam.

Frequently asked questions about living in Heerjansdam

Short answers based on current local statistics, handy for a quick comparison of the living environment.

Hoeveel inwoners heeft Heerjansdam?

Heerjansdam telt in 2025 ongeveer 3.790 inwoners.

Wat is de gemiddelde WOZ-waarde in Heerjansdam?

De gemiddelde WOZ-waarde in Heerjansdam is in 2025 circa € 432.846.

Wat is het gemiddelde inkomen per inwoner in Heerjansdam?

Het gemiddelde inkomen per inwoner in Heerjansdam ligt rond € 32.774 per jaar.

Hoe veilig is wonen in Heerjansdam?

Voor het huidige jaar gaat het om ongeveer 72 geregistreerde misdrijven. Gebruik deze cijfers als indicatie en vergelijk trends per periode.

Welke woningtypen komen het meest voor in Heerjansdam?

In Heerjansdam komt vooral "Tussenwoningen" veel voor, met ongeveer 681 woningen.

Gratis vrijblijvende offertes ontvangen

Vergelijk meerdere makelaars en kies de beste match.