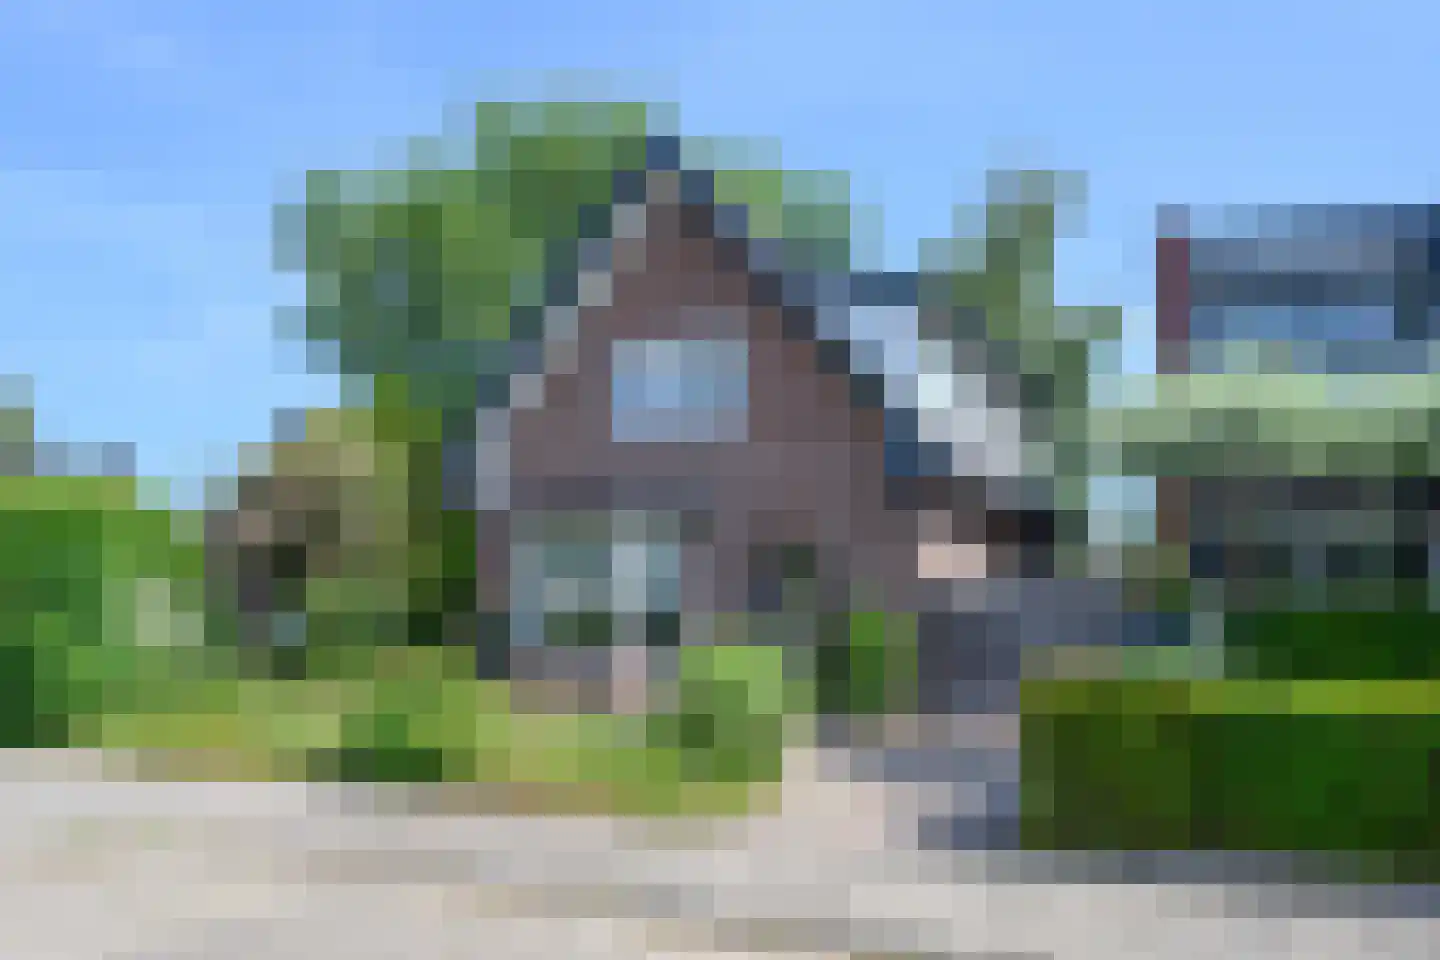
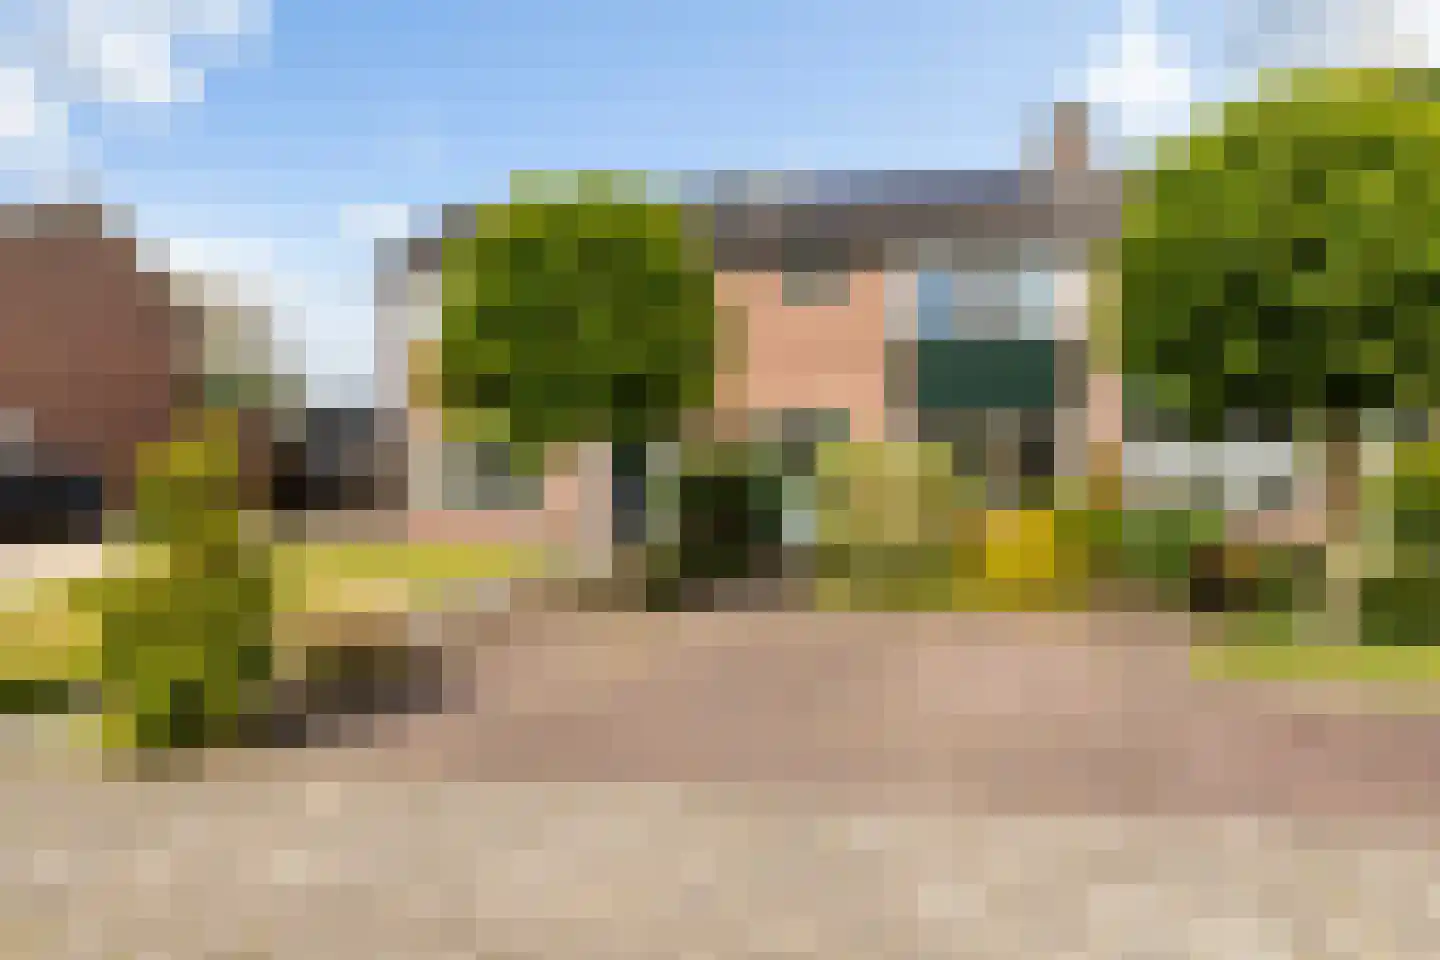
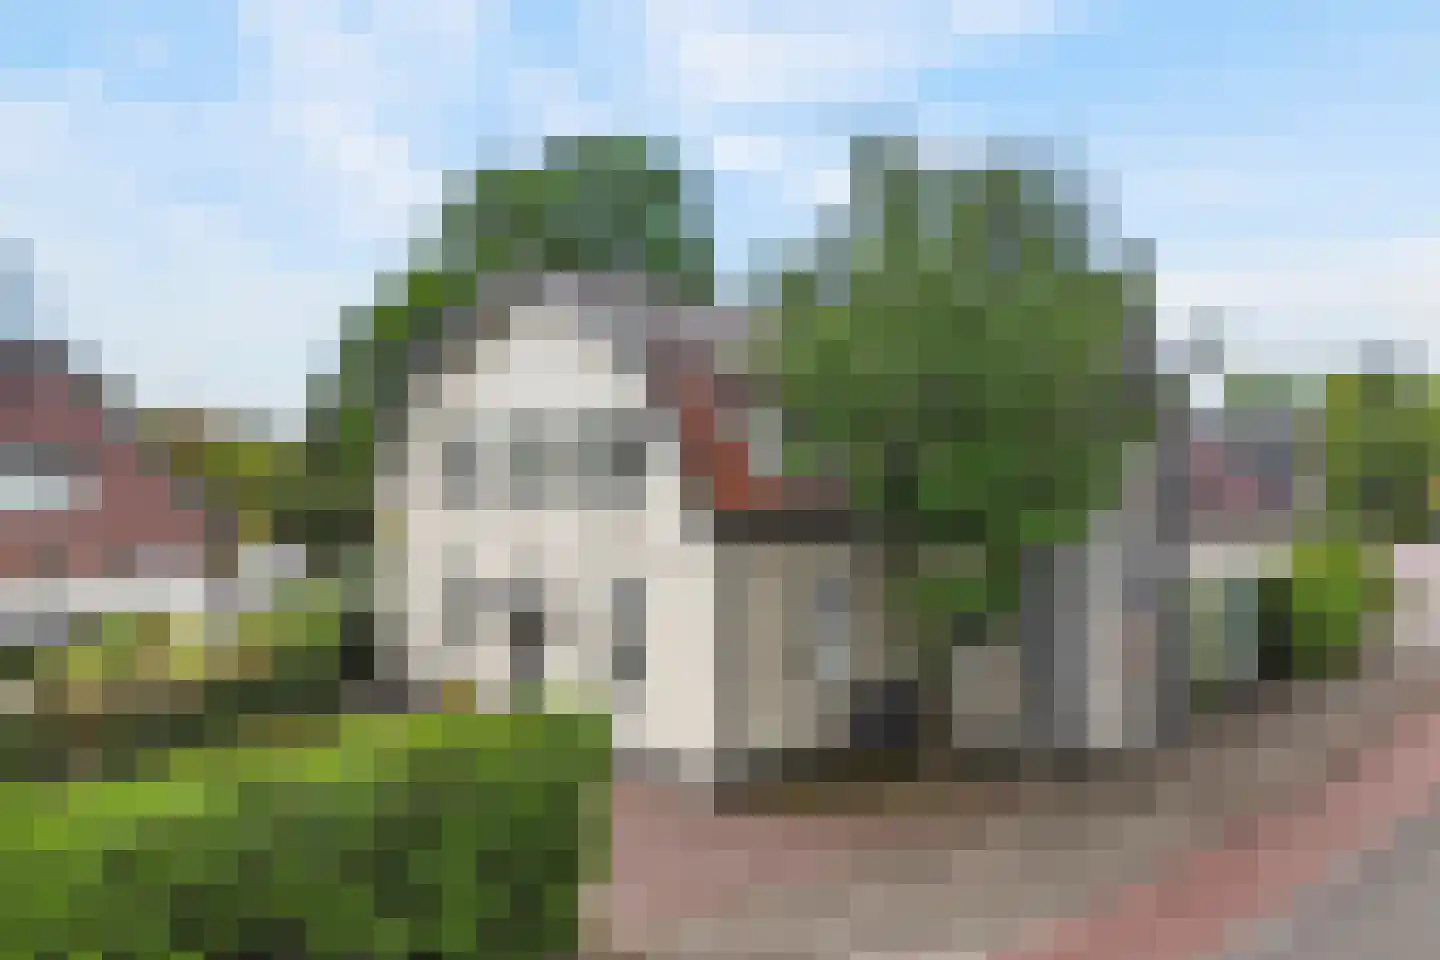
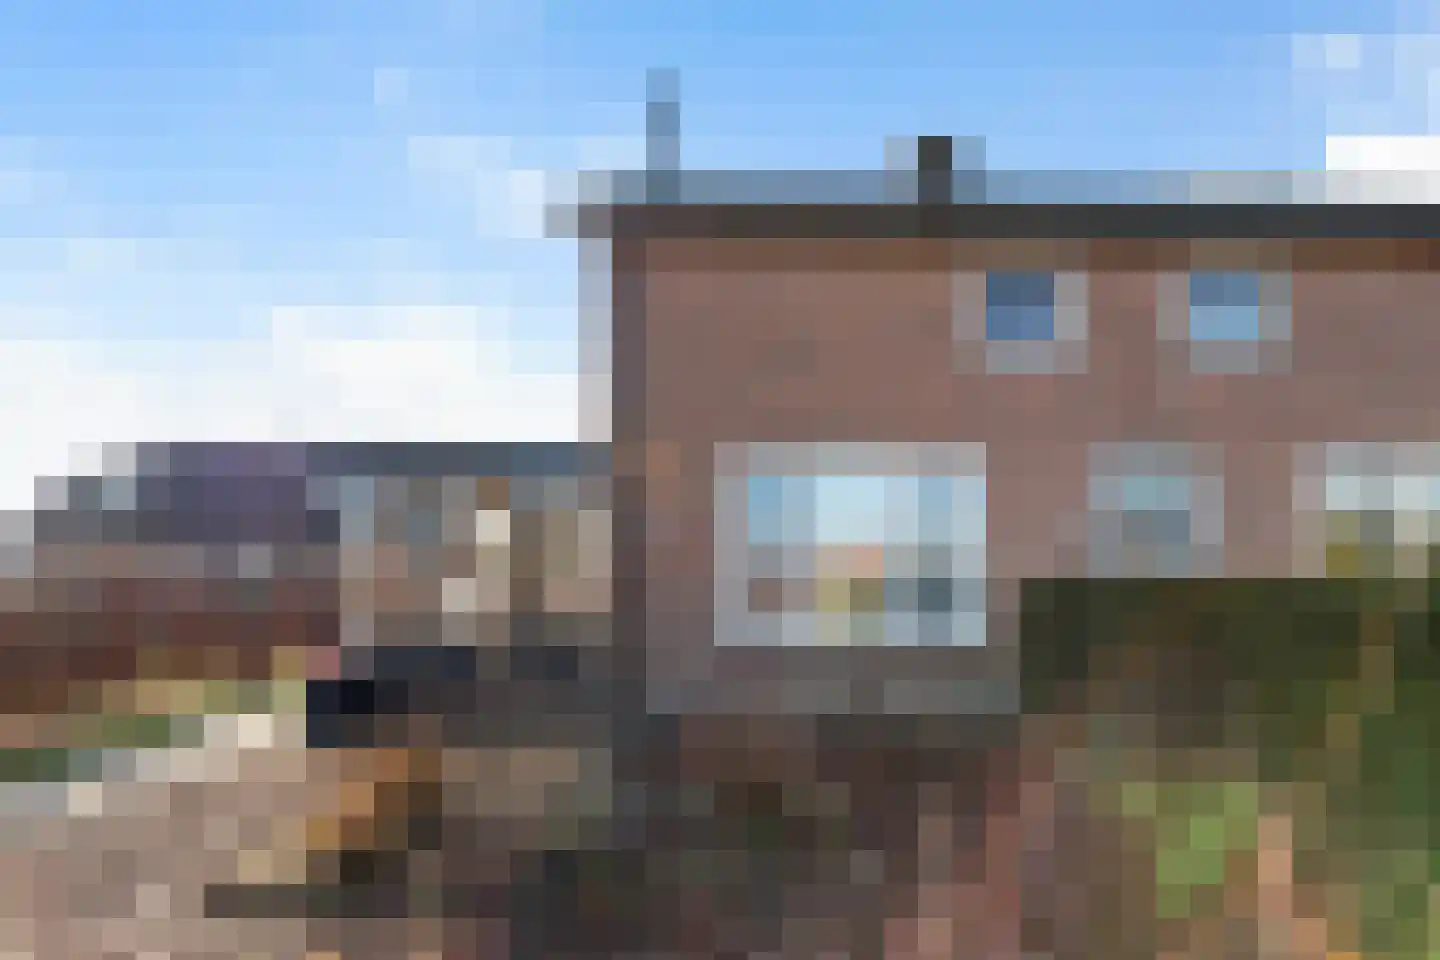
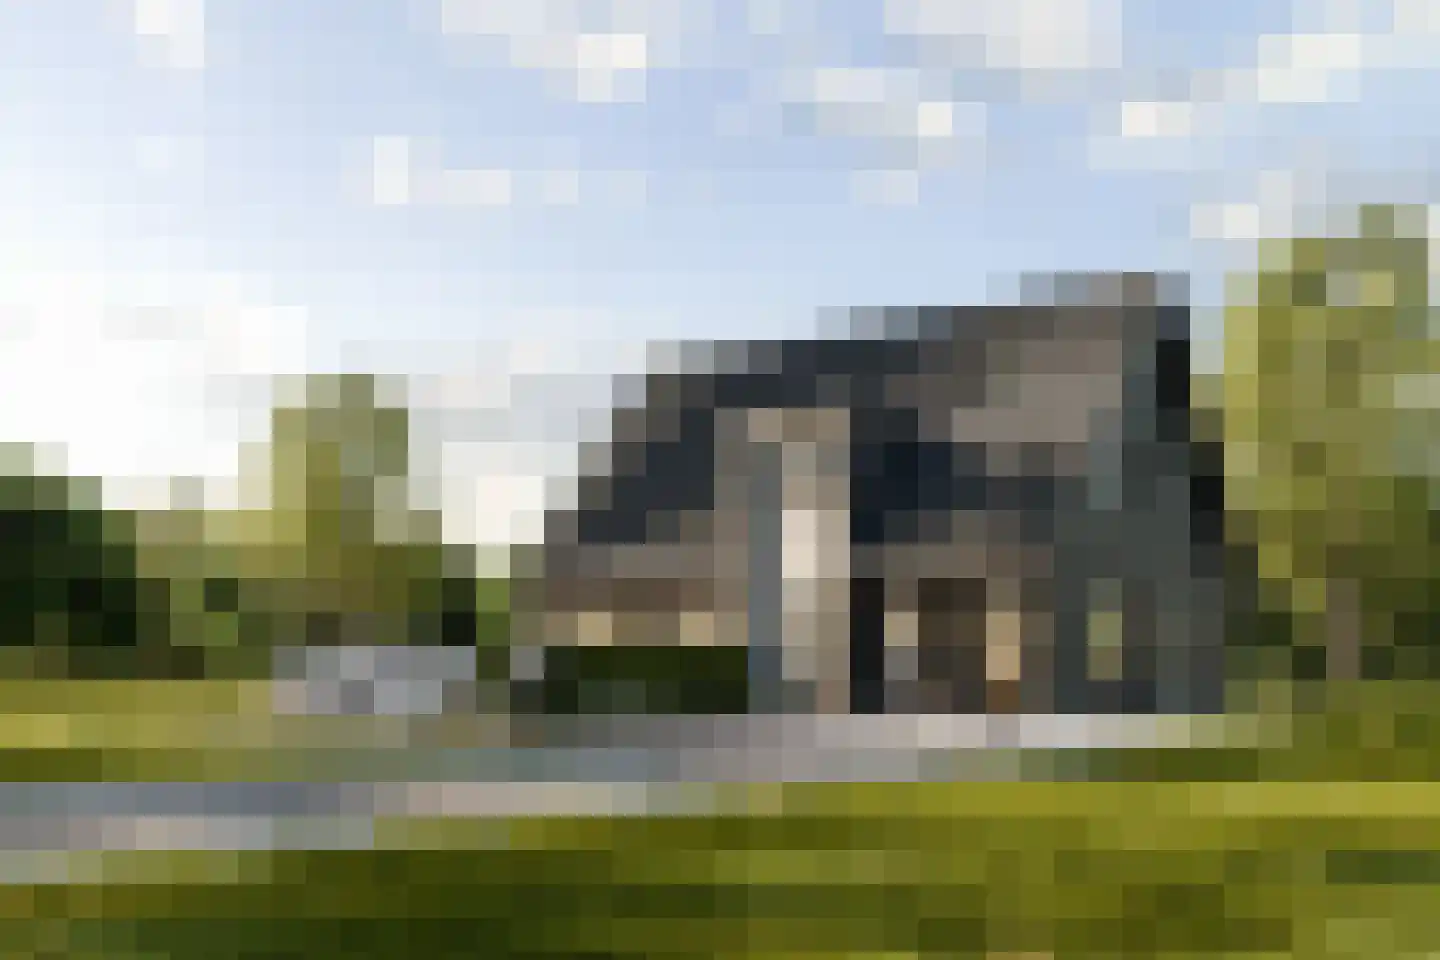
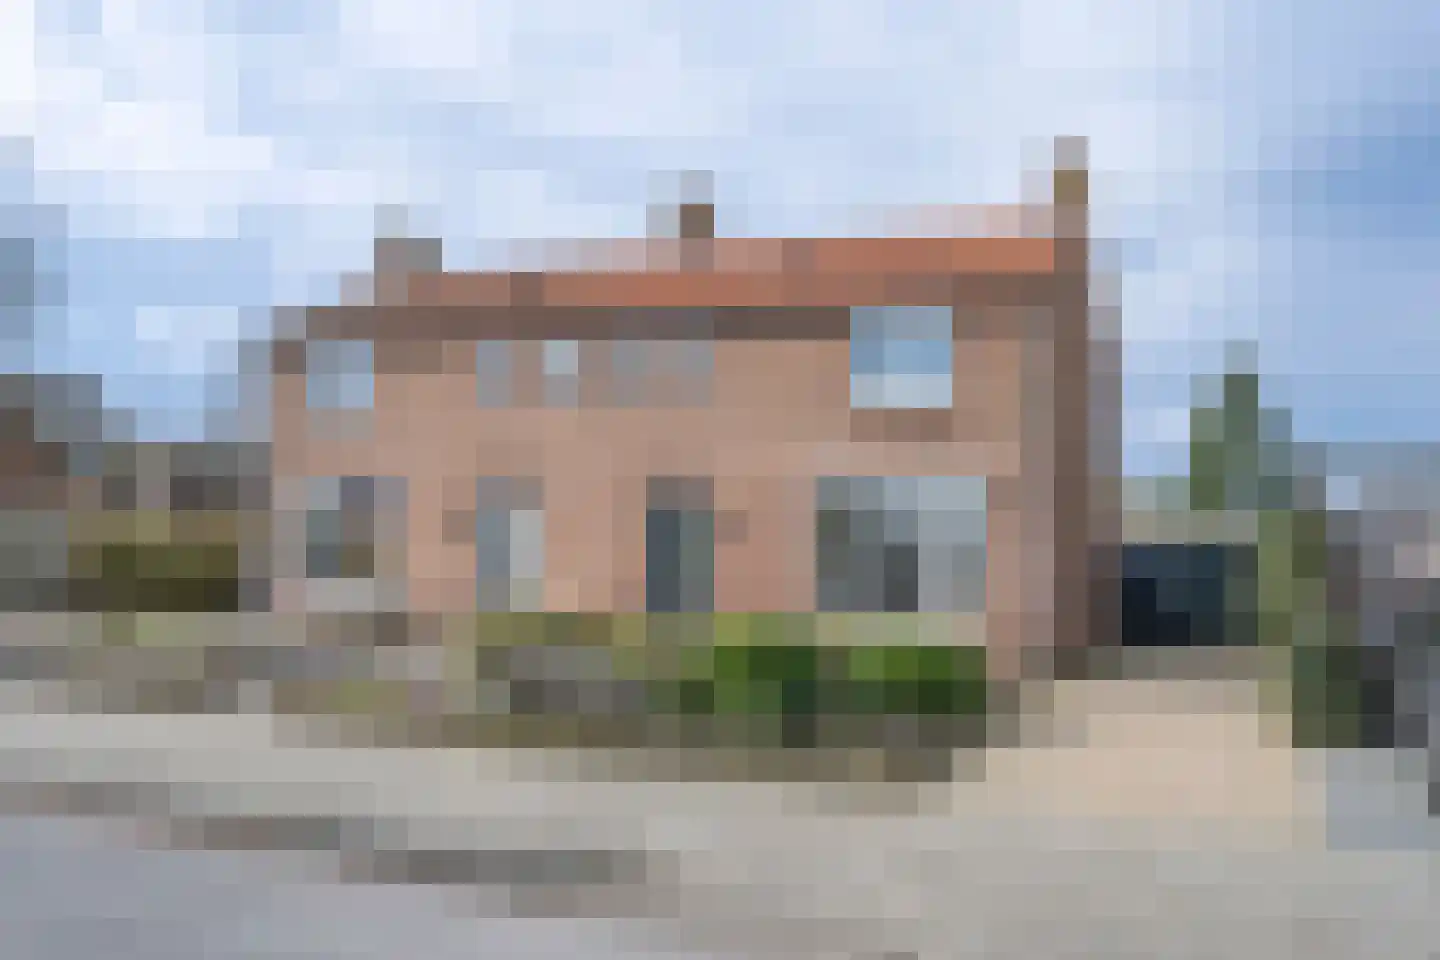
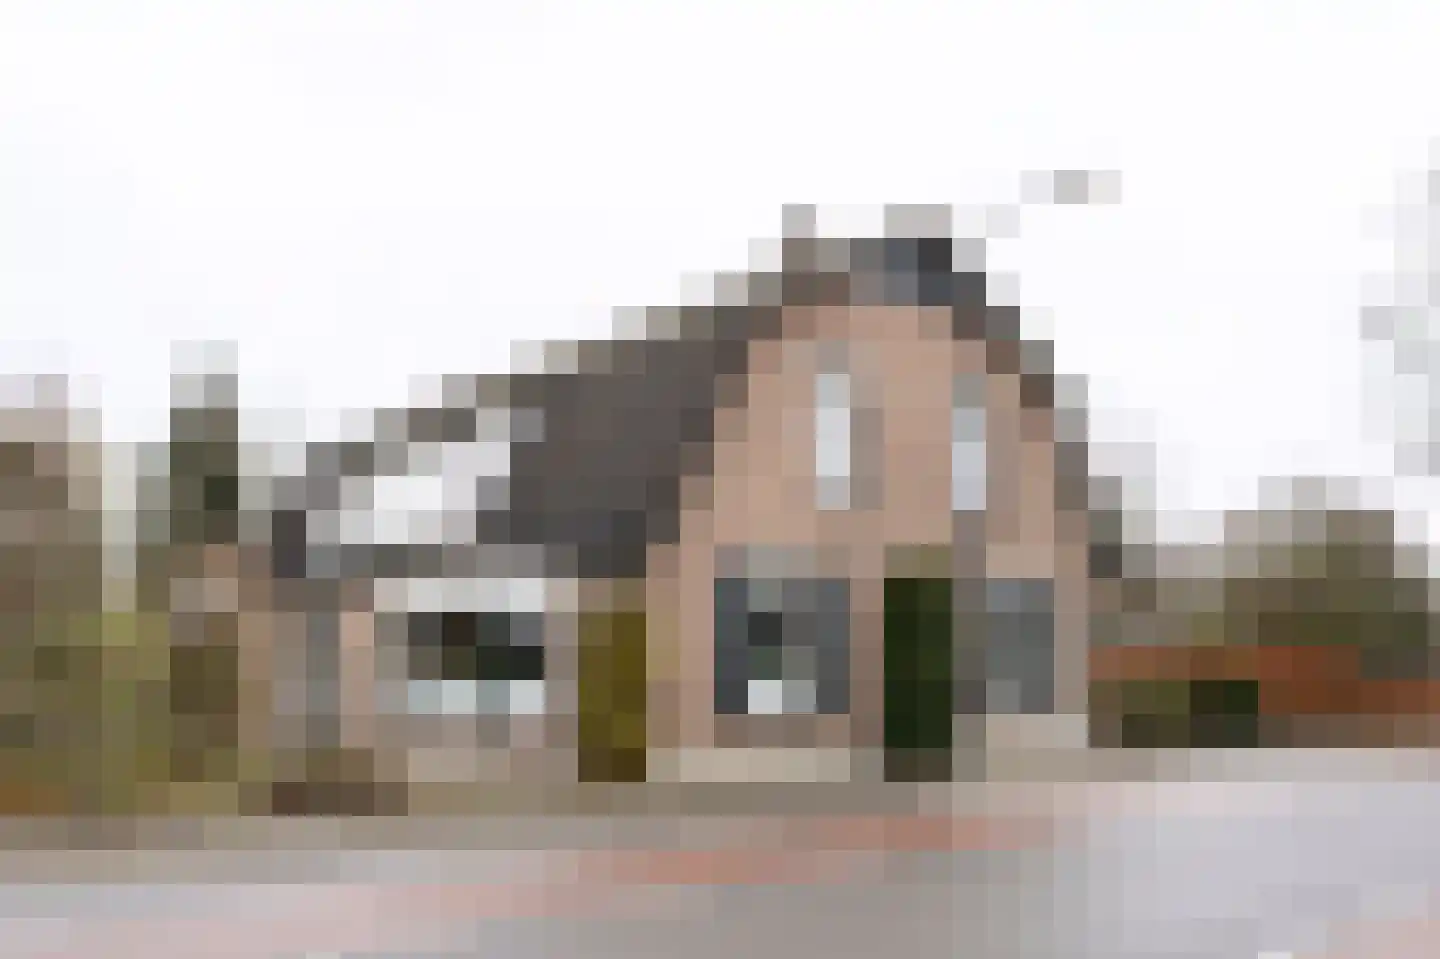
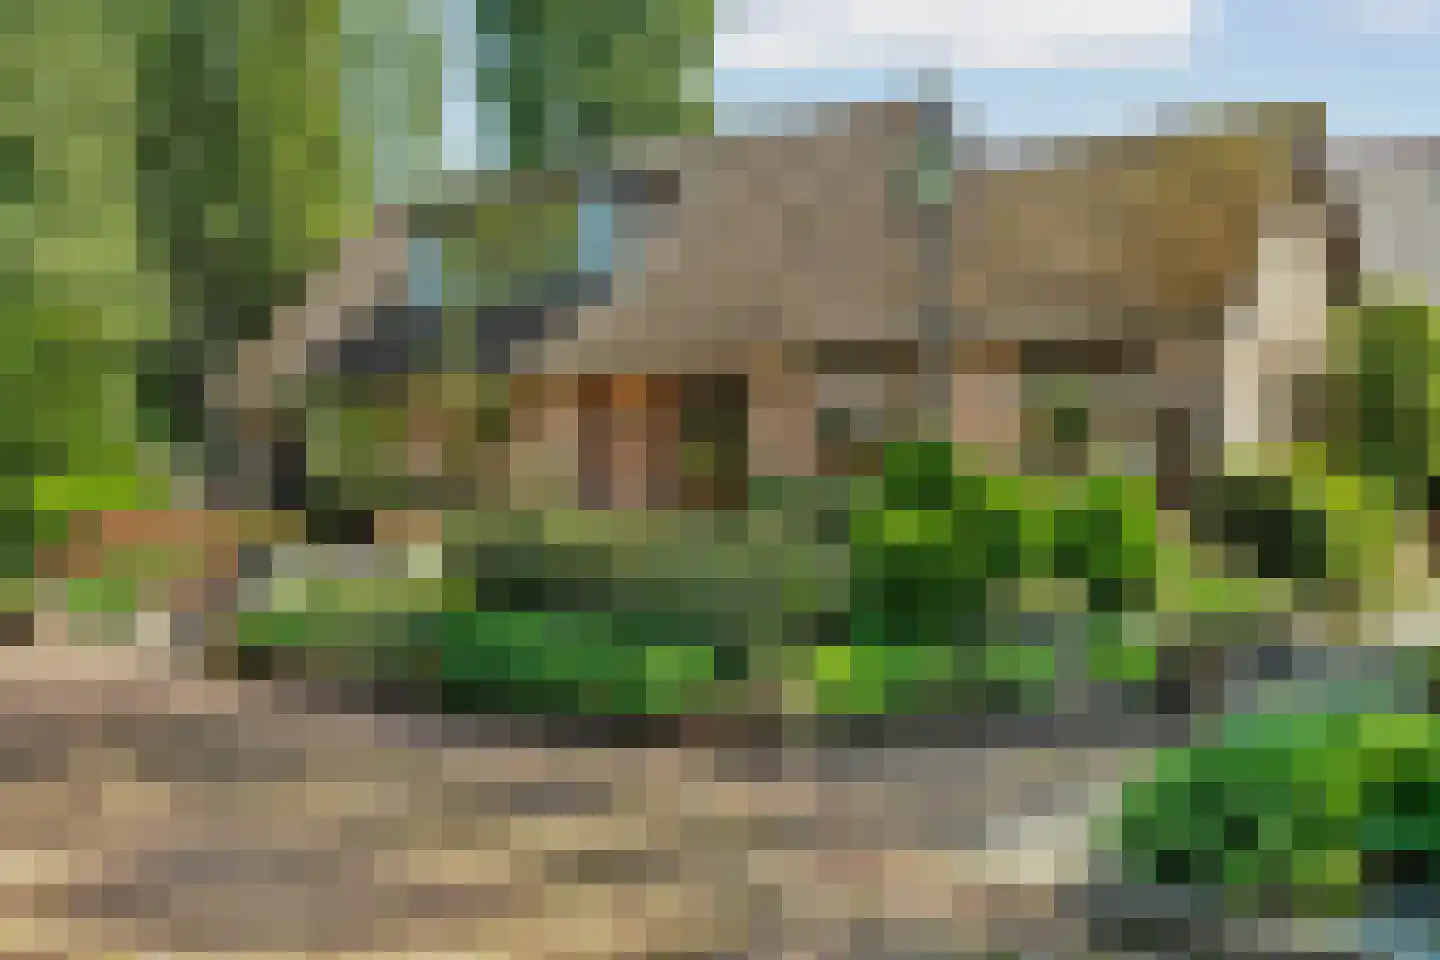
- Available
Eerbeekseweg 42
7371CH Loenen
€ 795.000 k.k.
€ 6.463/m²
- Living area
- 123 m²
- Land area
- 1832 m²
- Bedrooms
- 3
Searching in 39 houses in Loenen
Type to search. Use arrow down and arrow up to navigate through results and press Enter to open.
Hidden search suggestions.
View current properties in Loenen or search targeted on street, postal code and property characteristics.
View the current housing stock in Loenen and quickly filter by price, living area, rooms and more. There are currently 39 houses in this place within our selection. View also 22 sold houses in Loenen for extra insight into the local housing market.
7371CH Loenen
€ 795.000 k.k.
€ 6.463/m²
7371CB Loenen
€ 449.000 k.k.
€ 5.102/m²
7371BN Loenen
€ 625.000 k.k.
€ 5.000/m²
7371AP Loenen
€ 365.000 k.k.
€ 3.883/m²
7371AJ Loenen
€ 629.000 k.k.
€ 4.006/m²
7371CL Loenen
€ 499.500 k.k.
7371EJ Loenen
€ 450.000 k.k.
7371EJ Loenen
€ 300.000 k.k.
7371CX Loenen
€ 825.000 k.k.
€ 2.242/m²
7371ES Loenen
€ 849.000 k.k.
€ 3.613/m²
7371BW Loenen
€ 585.000 k.k.
€ 4.875/m²
7371CN Loenen
€ 739.000 k.k.
€ 4.016/m²
7371CP Loenen
€ 799.000 k.k.
€ 3.936/m²
7371BJ Loenen
€ 329.000 k.k.
€ 3.917/m²
7371AP Loenen
€ 357.500 k.k.
€ 4.643/m²
7371CB Loenen
€ 419.000 k.k.
€ 5.238/m²
7371BD Loenen
€ 589.000 k.k.
€ 5.078/m²
7371CC Loenen
€ 849.000 k.k.
€ 5.896/m²
7371BV Loenen
€ 385.000 k.k.
€ 5.347/m²
7371EK Loenen
€ 795.000 k.k.
€ 6.360/m²
7371CW Loenen
€ 795.000 k.k.
€ 8.457/m²
7371KC Loenen
€ 725.000 k.k.
€ 5.000/m²
7371AM Loenen
€ 399.000 k.k.
€ 6.435/m²
7371AD Loenen
€ 625.000 k.k.
€ 4.496/m²
7371BN Loenen
€ 750.000 k.k.
€ 3.554/m²
7371CN Loenen
€ 375.000 k.k.
€ 3.605/m²
7371BX Loenen
€ 675.000 k.k.
€ 4.326/m²
7371EG Loenen
€ 1.095.000 k.k.
€ 7.657/m²
Get free quotes from real estate agents with local market knowledge. Compare more than 19 real estate agents in Loenen.
Selling a home in Loenen? View the sales-oriented guide sell a house in Loenen, compare all real estate agents in Loenen or view the top 10 real estate agents in Loenen for extra context to your choice.
Real estate agents make sharper offers when they know you're comparing — ask for quotes for sale or purchase.
Practical answers about housing supply, sales and comparing real estate agents in Loenen.
The costs of a real estate agent in Loenen depend on commission, setup costs, property presentation and the chosen service. Compare the 19 real estate agents in Loenen via the real estate agent page and request multiple quotes to compare rates and approach well.
Within our selection, we are currently showing 39 houses in Loenen. View also the sold houses in Loenen to compare the current offering with recent transactions.
Take into account not only price and living area but also maintenance, energy label, location, outdoor space and sales status. This way you compare houses in Loenen on more than just the asking price.
A local real estate agent knows the neighborhoods, recent transactions and demand in Loenen. By comparing 19 real estate agents in the region you get a better insight into prices, sales strategy and expected yield; the top 10 in Loenen provides a useful starting point.
Yes, when making a sales plan, a valuation in Loenen is wise. You gain insight into a realistic asking price and can then compare offers from real estate agents specifically.
View current location data on residents, WOZ development, housing stock, energy consumption, business activity and safety in Loenen. In 2026 were there 3.258 residents. The average WOZ value in 2025 is EUR 504.000.
These figures help to better assess and compare the housing stock in Loenen with recent sold homes. Orient yourself then on suitable top real estate agents in Loenen for sales advice in this region.
Residents
3.258
Last year: 2026
Average WOZ
EUR 504.000
Last year: 2025
Average income per person.
EUR 38.900
Source: AllNumbers
Crimes (current year)
85
Total registered
| Year | Residents |
|---|---|
| 2021 | 3.380 |
| 2022 | 3.360 |
| 2023 | 3.345 |
| 2024 | 3.330 |
| 2025 | 3.300 |
| 2026 | 3.258 |
| Year | Average WOZ |
|---|---|
| 2021 | EUR 365.000 |
| 2022 | EUR 397.000 |
| 2023 | EUR 473.000 |
| 2024 | EUR 497.000 |
| 2025 | EUR 504.000 |
Hoger
730
Praktisch
630
Middelbaar
1.190
Europa
155
Nederland
2.965
Buiten Europa
180
Label A
307
Label C
283
Label G
271
Label B
191
Label D
156
Label F
146
Label E
77
Label A+
8
Label A+++
7
Label A++
4
Label A++++
3
Label A+++++
0
| Year | Gas (m3) | Electricity (kWh) |
|---|---|---|
| 2020 | 1.560 | 3.270 |
| 2021 | 1.760 | 3.370 |
| 2022 | 1.380 | 3.200 |
| 2023 | 1.110 | 3.020 |
| 2024 | 1.080 | 3.180 |
Hoekwoning
Gas: 1.010 • Electricity: 2.290
Huurwoning
Gas: 990 • Electricity: 2.200
Koopwoning
Gas: 1.160 • Electricity: 3.340
Appartement
Gas: 670 • Electricity: 1.950
Tussenwoning
Gas: 890 • Electricity: 2.110
Vrijstaande woning
Gas: 1.350 • Electricity: 3.870
Twee-onder-één-kap woning
Gas: 1.050 • Electricity: 2.910
Total number of company establishments: 490
| Period | Crimes |
|---|---|
| jan 2026 | 6 |
| jul 2025 | 5 |
| jun 2025 | 9 |
| mei 2025 | 2 |
| mrt 2025 | 9 |
| mrt 2026 | 7 |
| nov 2024 | 13 |
| nov 2025 | 5 |
| okt 2024 | 3 |
| okt 2025 | 7 |
| sep 2024 | 9 |
| sep 2025 | 8 |
These figures give an indicative picture of safety trends in the living environment of Loenen.
Short answers based on current local statistics, handy for a quick comparison of the living environment.
Loenen telt in 2026 ongeveer 3.258 inwoners.
De gemiddelde WOZ-waarde in Loenen is in 2025 circa € 504.000.
Het gemiddelde inkomen per inwoner in Loenen ligt rond € 38.900 per jaar.
Voor het huidige jaar gaat het om ongeveer 85 geregistreerde misdrijven. Gebruik deze cijfers als indicatie en vergelijk trends per periode.
In Loenen komt vooral "Vrijstaande woningen" veel voor, met ongeveer 627 woningen.