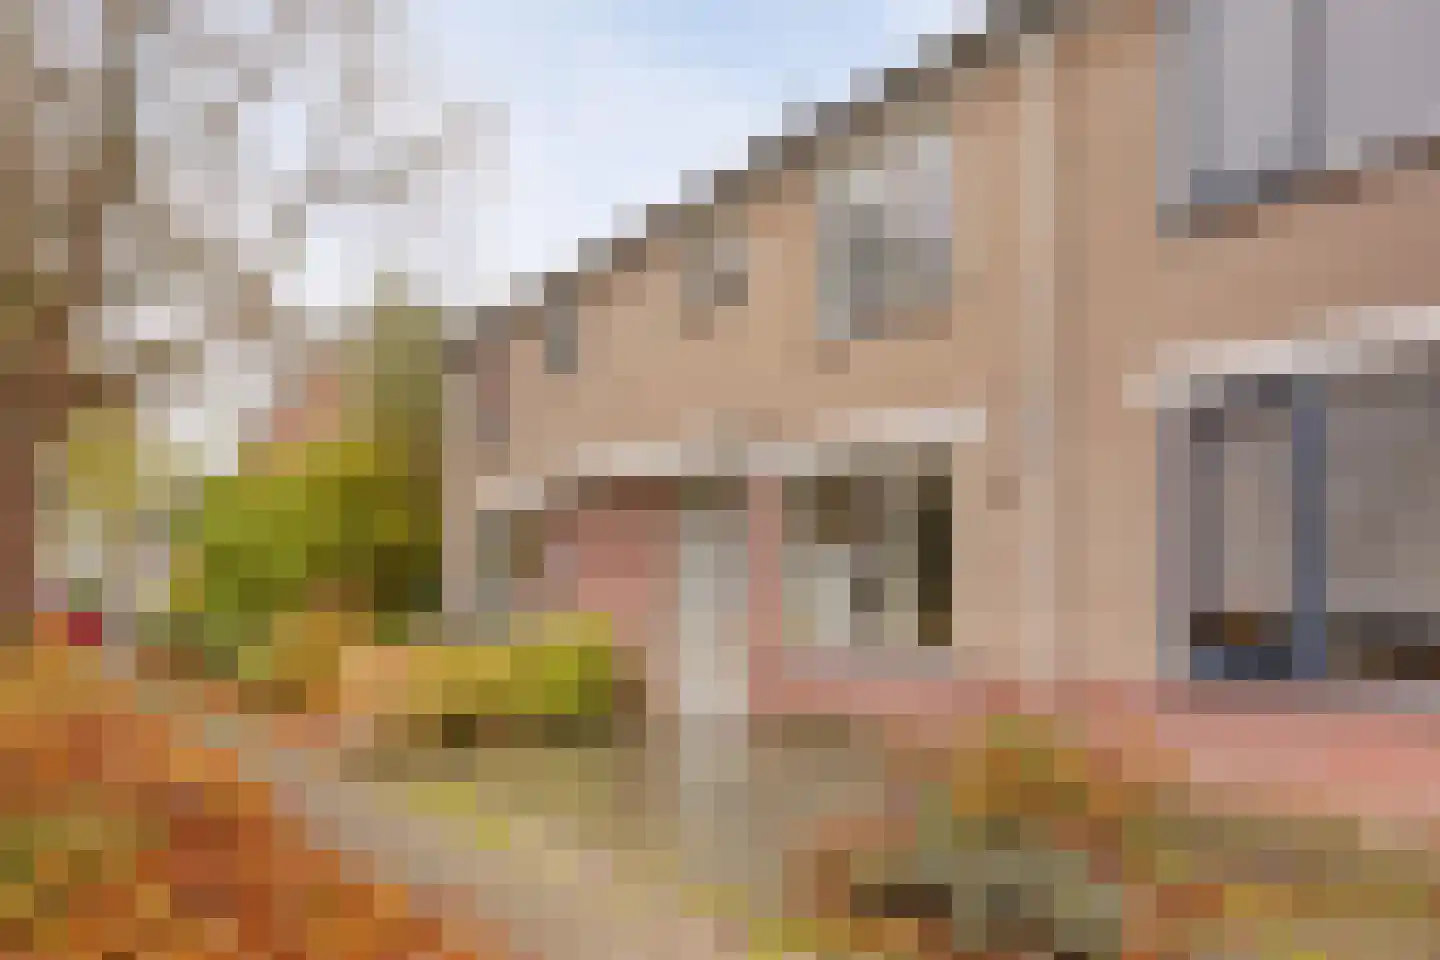
- Sold
Weteringpad 37 a
2481AS Woubrugge
€ 1.799.000 k.k.
€ 3.803/m²
- Living area
- 473 m²
- Land area
- 1493 m²
- Bedrooms
- 4
View 23 sold houses in Woubrugge
Type to search. Use arrow down and arrow up to navigate through results and press Enter to open.
Hidden search suggestions.
Compare sold homes in Woubrugge or view the current offering in this location directly.
On this page you will find recently sold homes in Woubrugge. Use this overview to better estimate selling prices, popular neighborhoods, and the local housing supply before you choose a real estate agent. Also view the current housing supply with 40 houses in Woubrugge.
2481AS Woubrugge
€ 1.799.000 k.k.
€ 3.803/m²
2481AH Woubrugge
€ 535.000 k.k.
€ 4.458/m²
2481CV Woubrugge
€ 450.000 k.k.
€ 5.555/m²
2481AK Woubrugge
€ 475.000 k.k.
€ 4.025/m²
2481BA Woubrugge
€ 500.000 k.k.
€ 4.000/m²
2481KW Woubrugge
€ 500.000 k.k.
€ 4.424/m²
2481AP Woubrugge
€ 450.000 k.k.
€ 4.090/m²
2481CD Woubrugge
€ 495.000 k.k.
€ 4.304/m²
2481LT Woubrugge
€ 500.000 k.k.
€ 6.024/m²
2481LW Woubrugge
€ 375.000 k.k.
€ 5.000/m²
2481KE Woubrugge
€ 200.000 k.k.
€ 3.448/m²
2481AV Woubrugge
Price upon request
2481KD Woubrugge
€ 1.250.000 k.k.
€ 7.102/m²
2481AL Woubrugge
€ 825.000 k.k.
€ 4.166/m²
2481KZ Woubrugge
€ 935.000 k.k.
€ 4.870/m²
2481BB Woubrugge
€ 489.500 k.k.
€ 3.947/m²
2481KR Woubrugge
€ 699.500 k.k.
€ 2.775/m²
2481AH Woubrugge
€ 335.000 k.k.
€ 4.785/m²
2481KC Woubrugge
€ 475.000 k.k.
€ 4.702/m²
2481CC Woubrugge
€ 675.000 k.k.
€ 5.443/m²
2481XA Woubrugge
€ 425.000 k.k.
€ 3.400/m²
2481LW Woubrugge
€ 600.000 k.k.
€ 5.769/m²
2481KA Woubrugge
€ 725.000 k.k.
€ 5.753/m²
Bekijk recente verkopen en ontvang gratis offertes van lokale makelaars. Vergelijk meer dan 108 makelaars in Woubrugge.
Zelf je woning verkopen in Woubrugge? Vergelijk verkoopmakelaars in Woubrugge of bekijk de beste verkoopmakelaars in Woubrugge als referentie bij jouw keuze.
Makelaars maken scherpere voorstellen als ze weten dat je vergelijkt — vraag offertes aan voor verkoop of aankoop.
Short answers about housing prices, sold homes and comparing real estate agents in Woubrugge.
De kosten van een makelaar in Woubrugge verschillen per kantoor, woningtype en verkoopaanpak. In Woubrugge kun je 108 real estate agents vergelijken; bekijk daarom ook de makelaars in Woubrugge om tarieven, presentatie en lokale ervaring beter naast elkaar te zetten.
On this page we currently show 23 sold houses in Woubrugge from our selection. This helps you to better assess recent transactions and the local housing market.
Houses sold in Woubrugge give insight into asking prices, house types and neighborhoods where recent transactions have taken place. Compare this also with the current housing stock in Woubrugge to better understand the market.
You can use sold homes as a first market indication, but a local real estate agent can better take into account finishing, location, maintenance and current demand in Woubrugge.
Vergelijk de 108 real estate agents in Woubrugge op lokale verkoopervaring, reviews, verwachte opbrengst, courtage en marketingaanpak. Bekijk verkoopmakelaars in Woubrugge of de top 10 makelaars in Woubrugge om snel sterke kantoren te ontdekken.
View current location data on residents, WOZ development, housing stock, energy consumption, business activity and safety in Woubrugge. In 2025 were there 3.685 residents. The average WOZ value in 2025 is EUR 488.062.
These figures help to better assess and compare the housing stock in Woubrugge with recent sold homes. Orient yourself then on suitable top real estate agents in Woubrugge for sales advice in this region.
Residents
3.685
Last year: 2025
Average WOZ
EUR 488.062
Last year: 2025
Average income per person.
EUR 33.558
Source: AllNumbers
Crimes (current year)
95
Total registered
| Year | Residents |
|---|---|
| 2021 | 3.600 |
| 2022 | 3.645 |
| 2023 | 3.735 |
| 2024 | 3.710 |
| 2025 | 3.685 |
| Year | Average WOZ |
|---|---|
| 2021 | EUR 354.737 |
| 2022 | EUR 380.456 |
| 2023 | EUR 447.156 |
| 2024 | EUR 466.607 |
| 2025 | EUR 488.062 |
Hoger
790
Praktisch
680
Middelbaar
1.180
Europa
305
Nederland
3.070
Buiten Europa
310
Label C
535
Label A
369
Label B
243
Label D
197
Label G
98
Label F
48
Label E
46
Label A++++
27
Label A+++
15
Label A+
14
Label A++
9
Label A+++++
0
| Year | Gas (m3) | Electricity (kWh) |
|---|---|---|
| 2020 | 1.303 | 3.147 |
| 2021 | 1.453 | 3.192 |
| 2022 | 1.085 | 2.950 |
| 2023 | 916 | 2.768 |
| 2024 | 888 | 2.856 |
Hoekwoning
Gas: 810 • Electricity: 2.635
Huurwoning
Gas: 637 • Electricity: 2.007
Koopwoning
Gas: 1.014 • Electricity: 3.053
Appartement
Gas: 509 • Electricity: 1.626
Tussenwoning
Gas: 708 • Electricity: 2.372
Vrijstaande woning
Gas: 1.336 • Electricity: 3.965
Twee-onder-één-kap woning
Gas: 1.074 • Electricity: 3.135
Total number of company establishments: 500
| Period | Crimes |
|---|---|
| jan 2025 | 8 |
| jan 2026 | 5 |
| jul 2025 | 12 |
| jun 2025 | 8 |
| mei 2025 | 17 |
| mrt 2025 | 7 |
| nov 2024 | 9 |
| nov 2025 | 3 |
| okt 2024 | 5 |
| okt 2025 | 7 |
| sep 2024 | 2 |
| sep 2025 | 5 |
These figures give an indicative picture of safety trends in the living environment of Woubrugge.
Short answers based on current local statistics, handy for a quick comparison of the living environment.
Woubrugge telt in 2025 ongeveer 3.685 inwoners.
De gemiddelde WOZ-waarde in Woubrugge is in 2025 circa € 488.062.
Het gemiddelde inkomen per inwoner in Woubrugge ligt rond € 33.558 per jaar.
Voor het huidige jaar gaat het om ongeveer 95 geregistreerde misdrijven. Gebruik deze cijfers als indicatie en vergelijk trends per periode.
In Woubrugge komt vooral "Tussenwoningen" veel voor, met ongeveer 594 woningen.