- Available
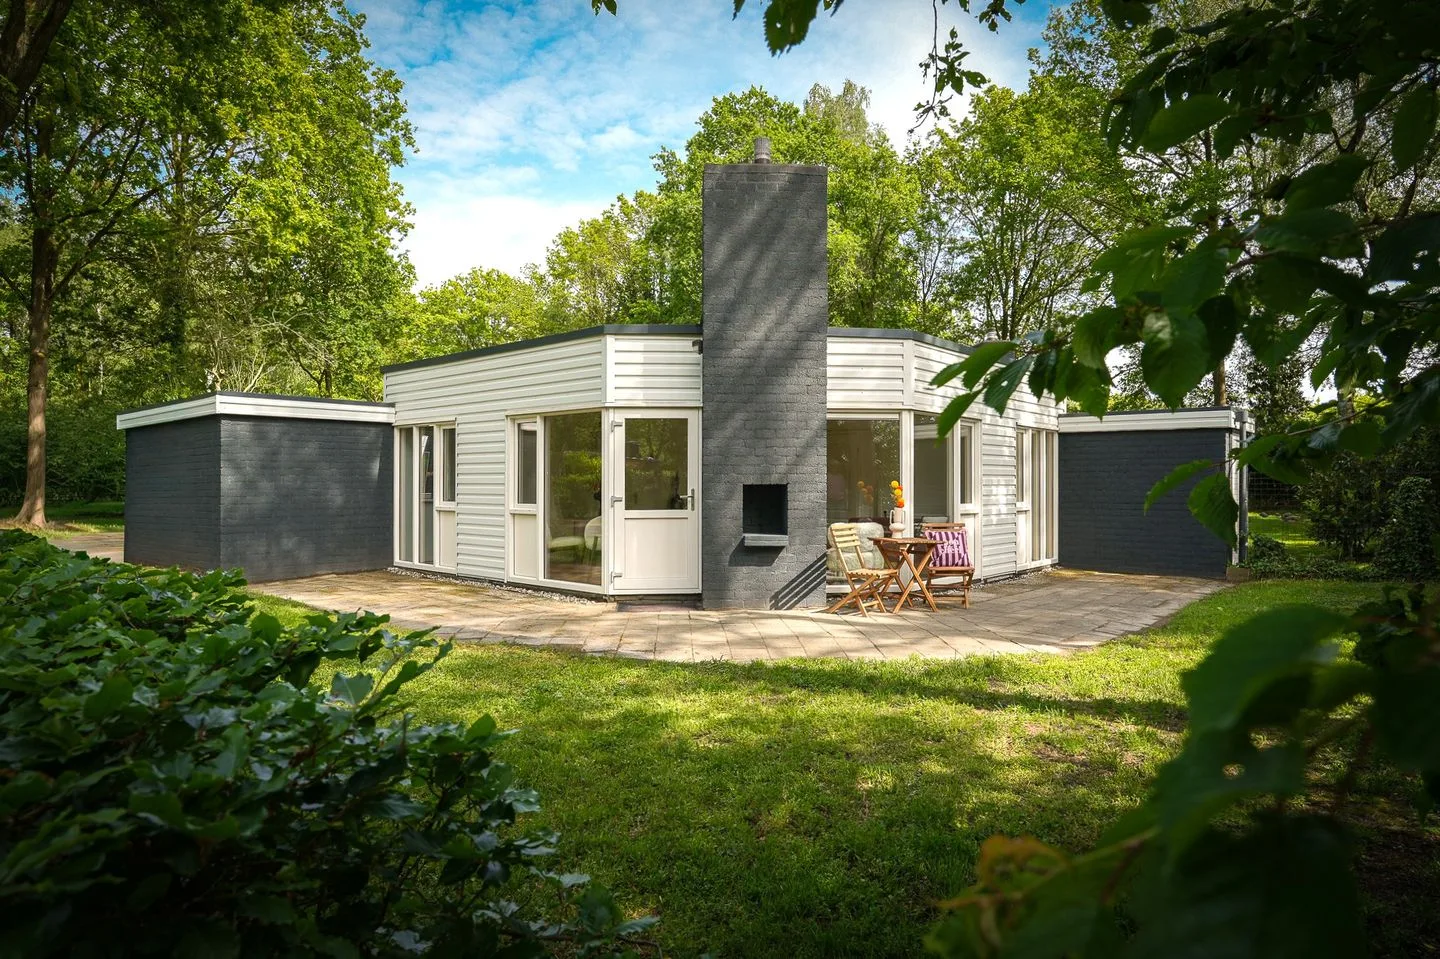
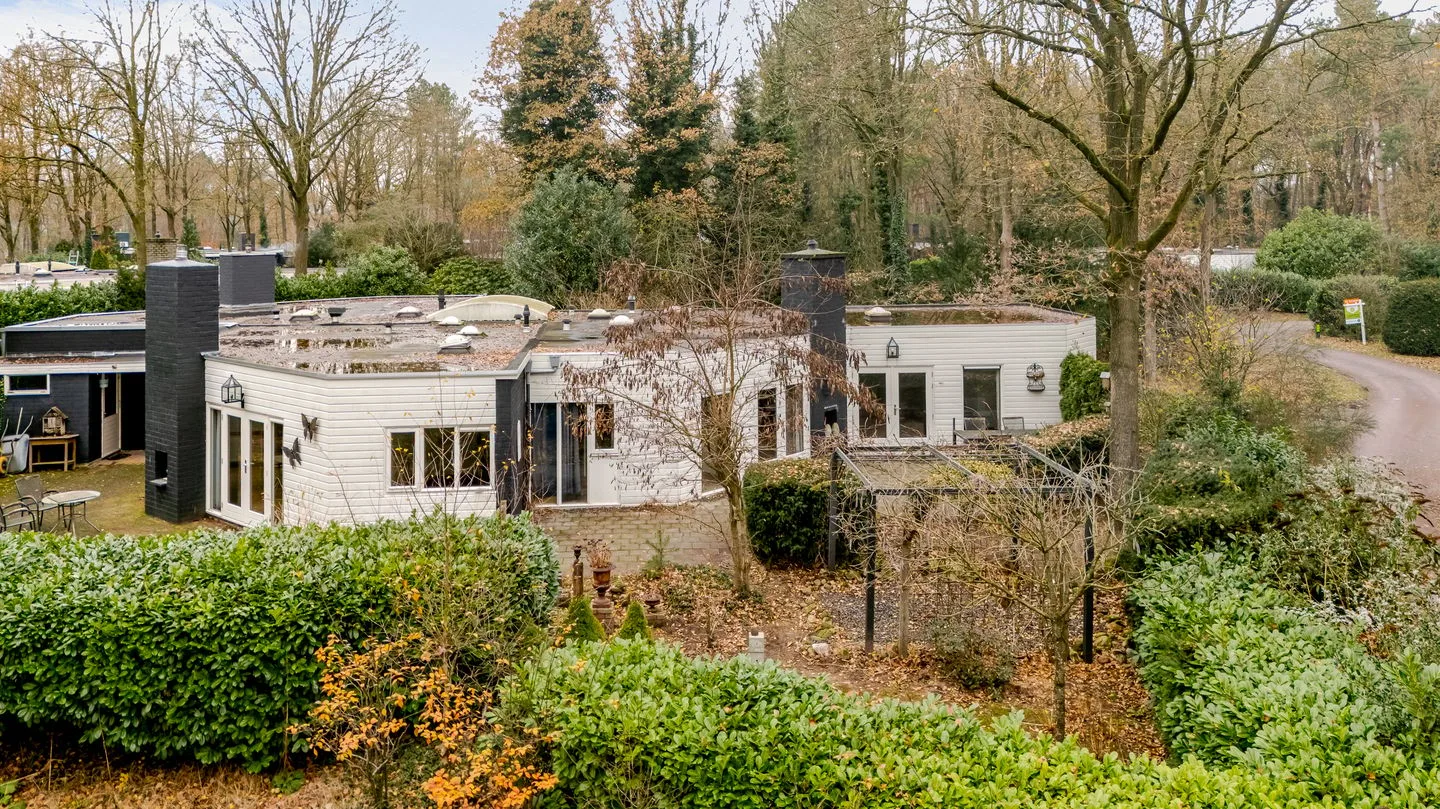
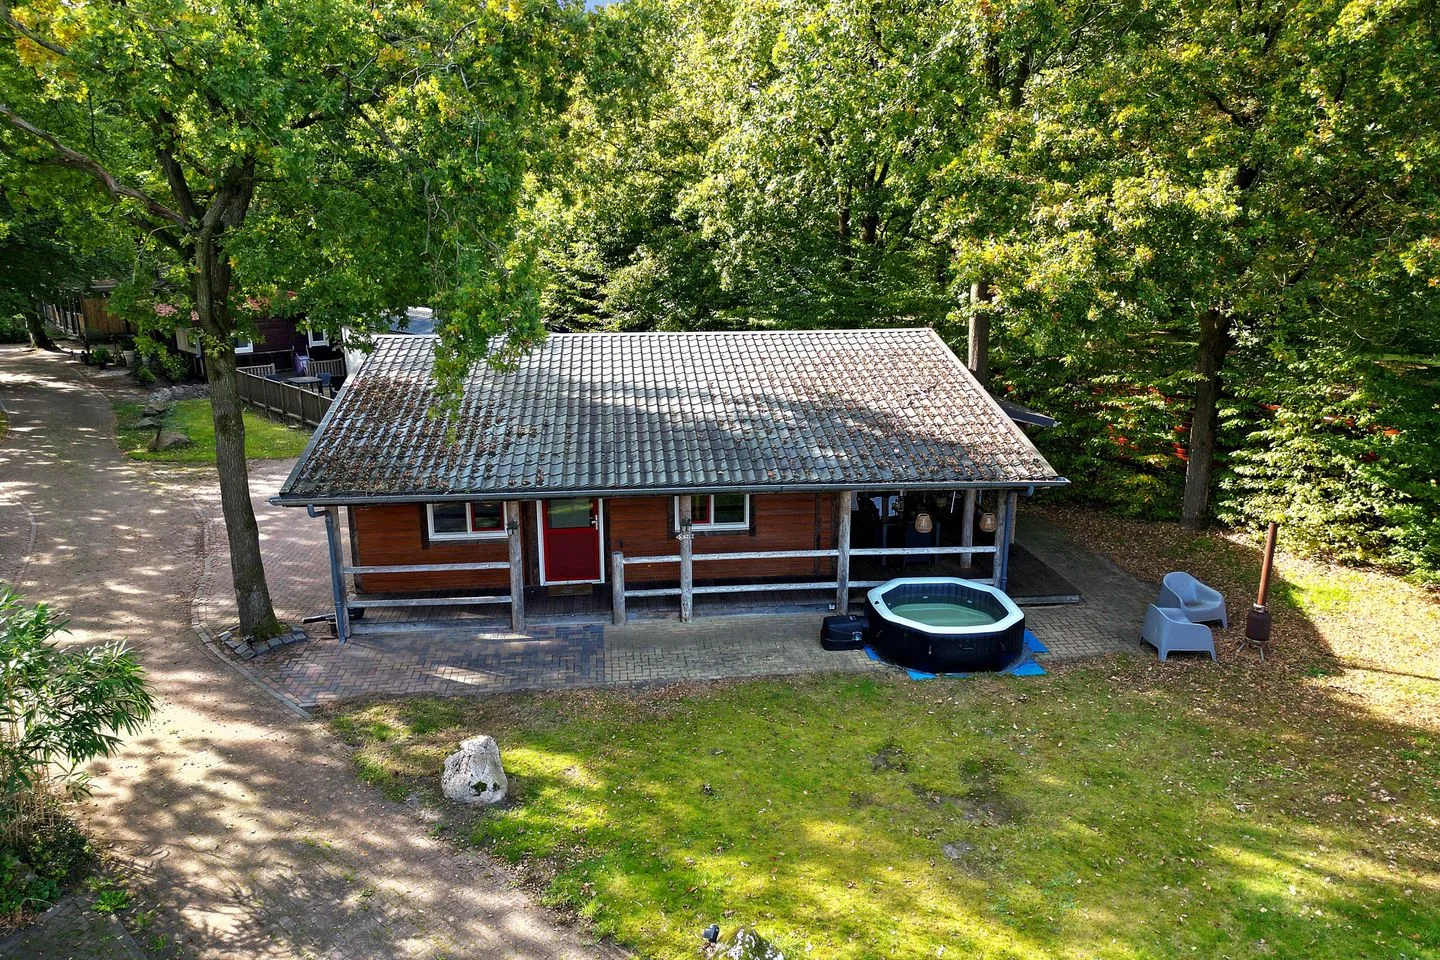
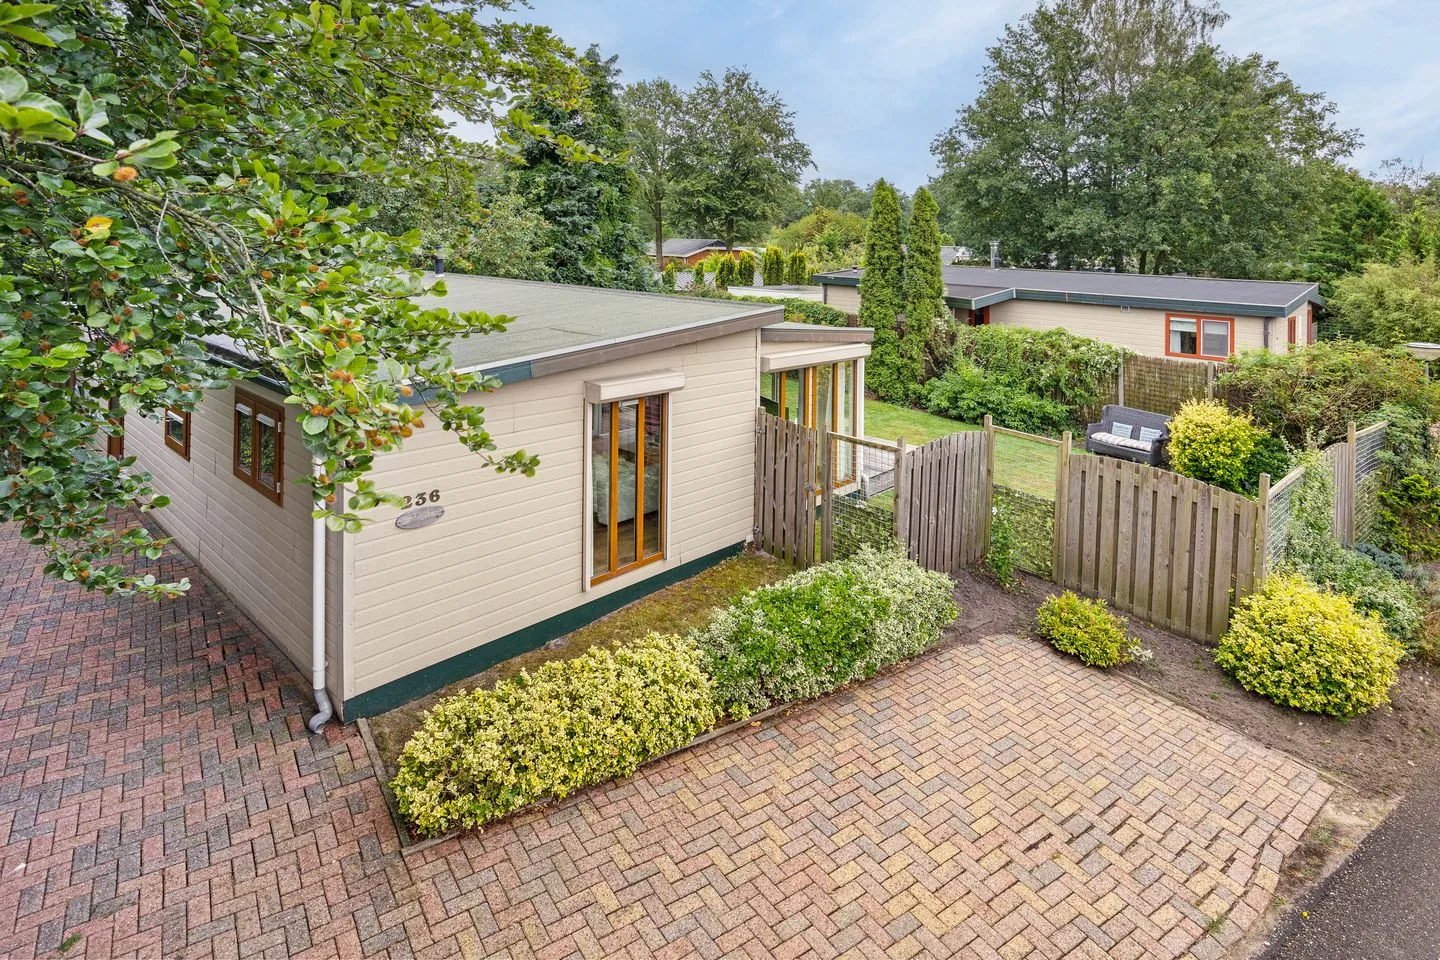
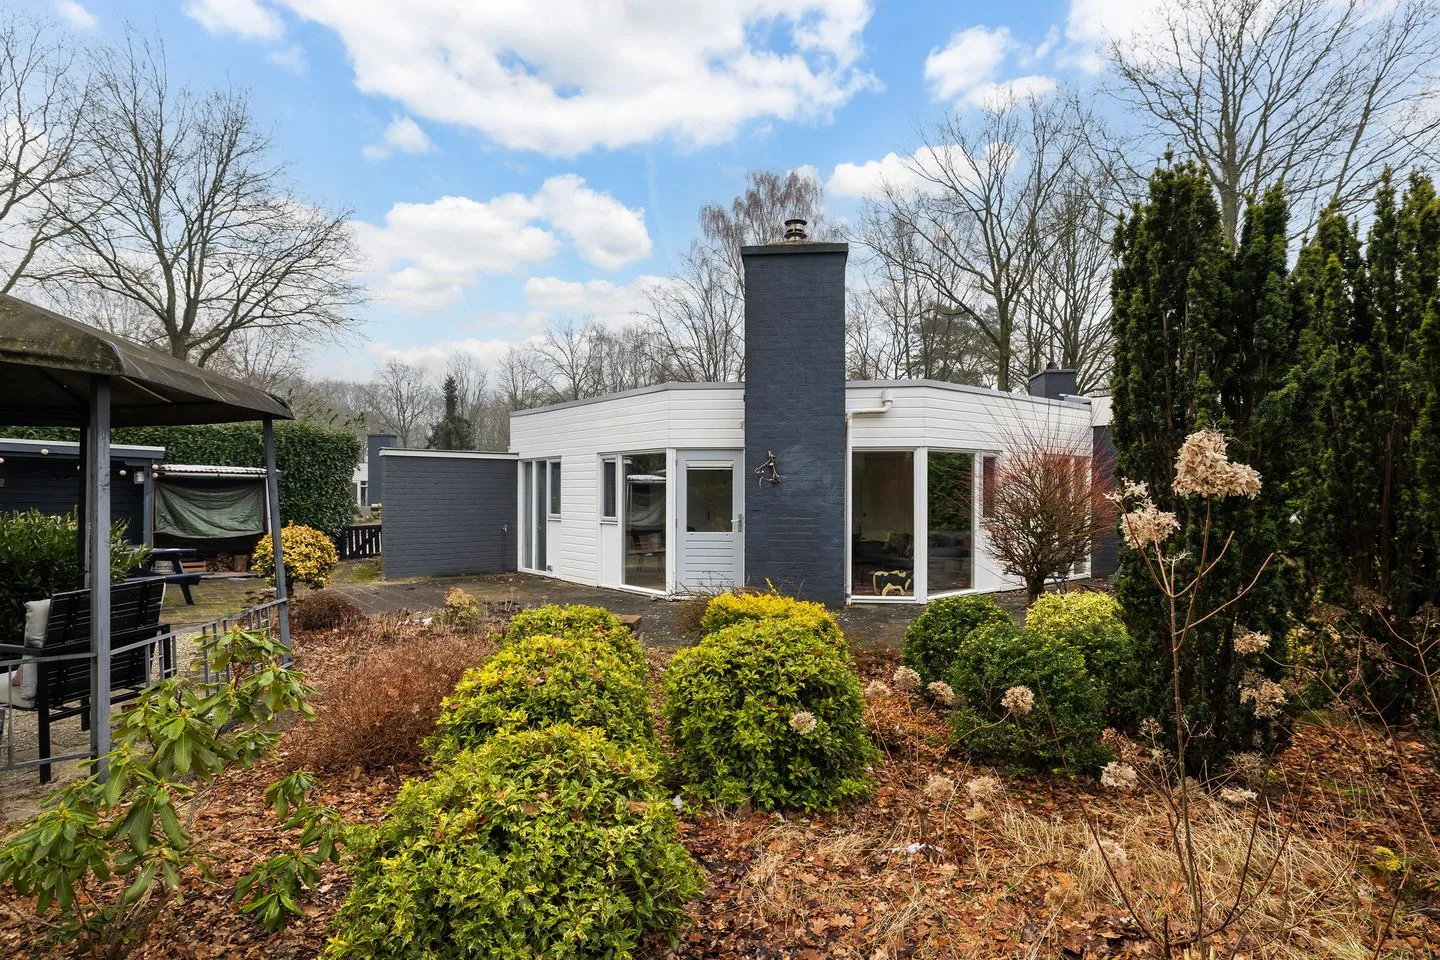
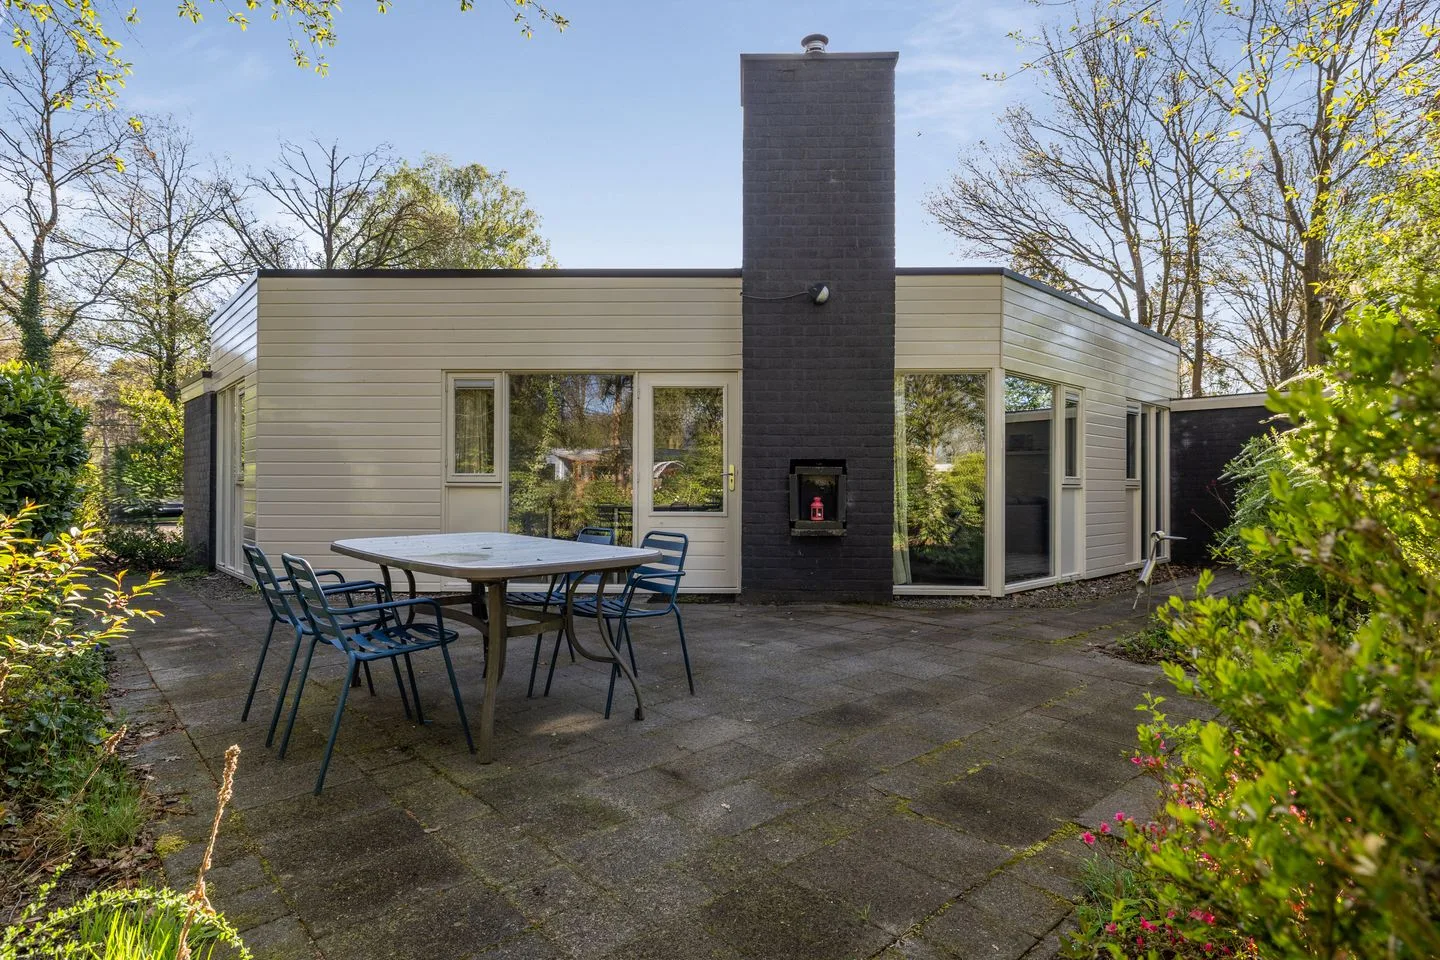
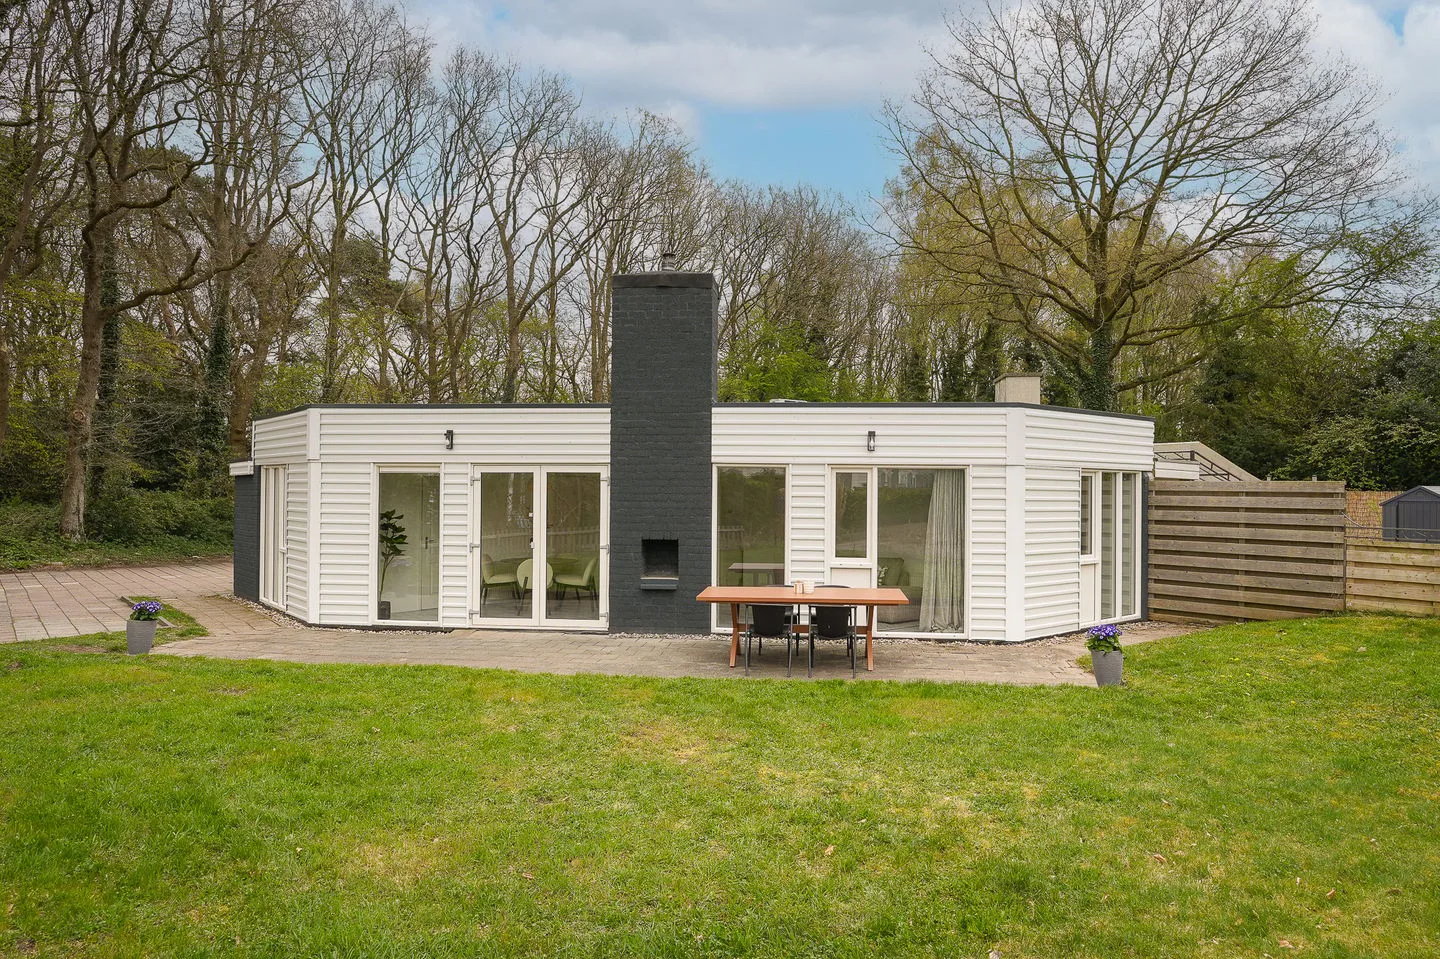
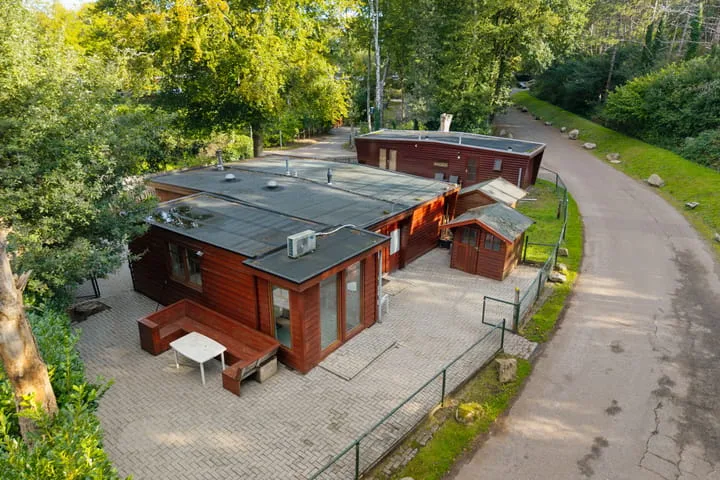
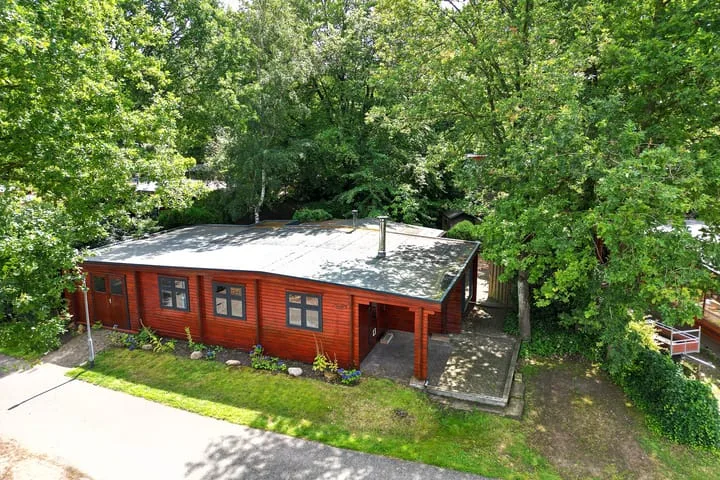
Ermerzand 44
7843PN Erm
€ 245.000 k.k.
€ 5.000/m²
Save as favorite
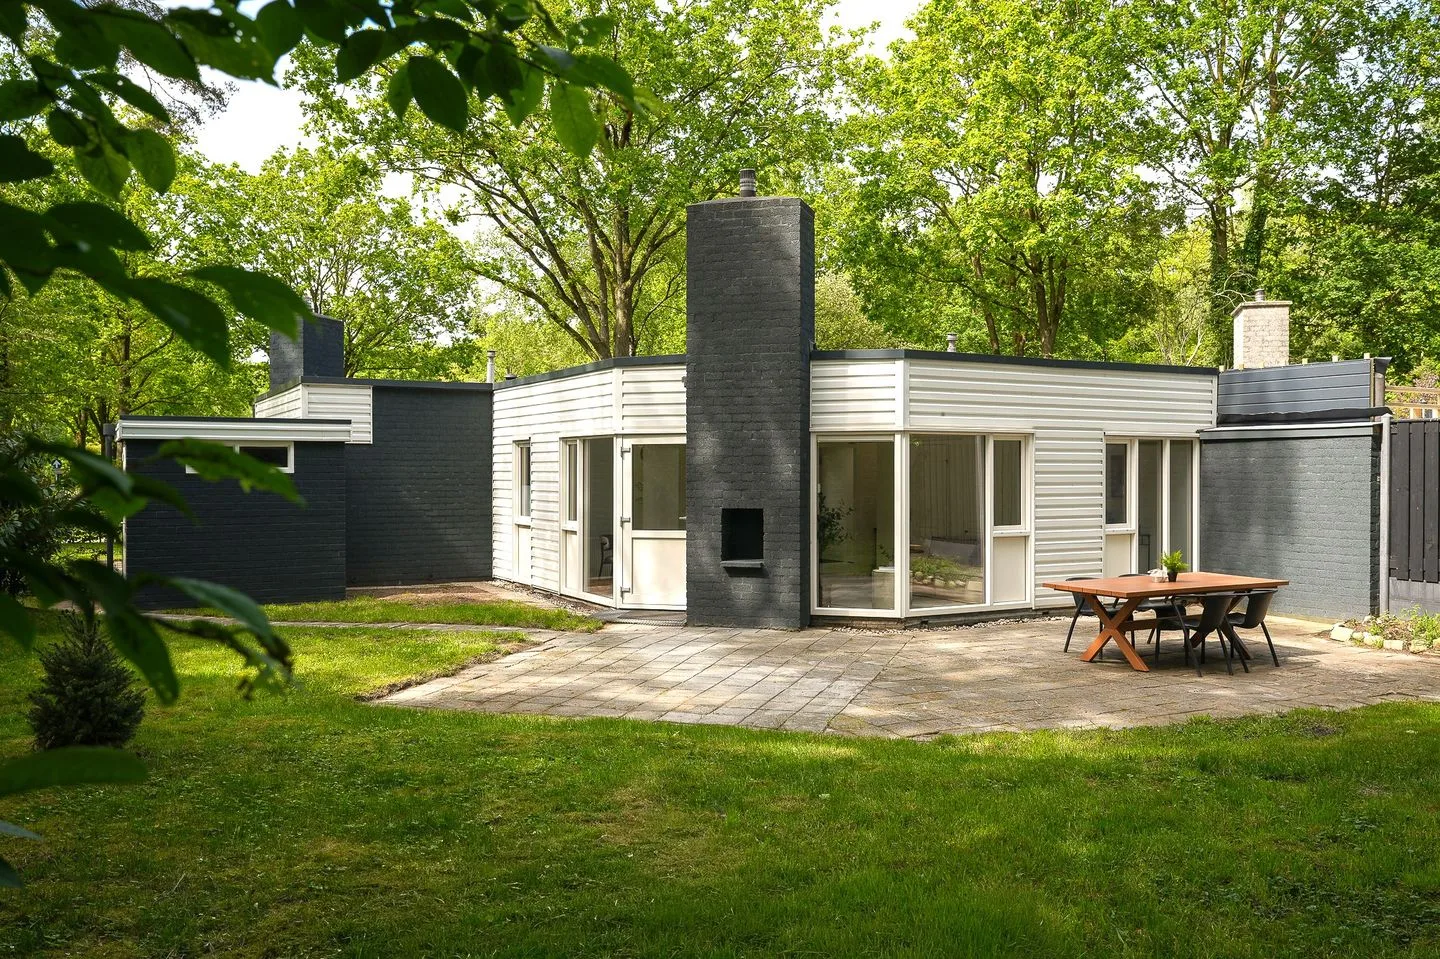
- Living area
- 49 m²
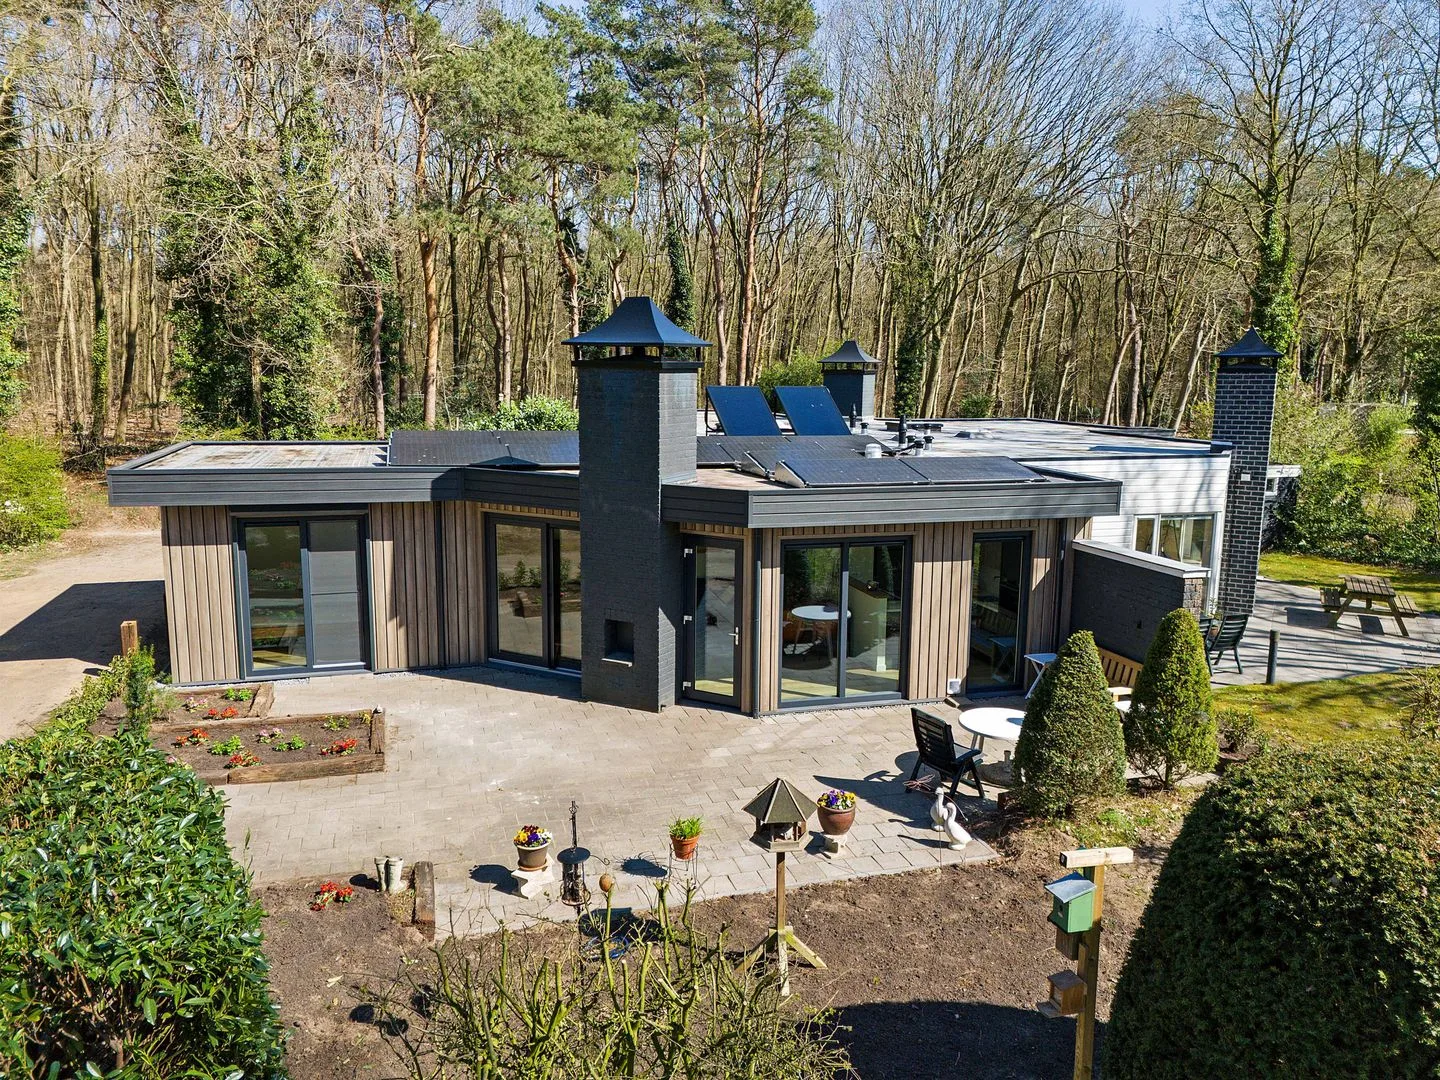
- Land area
- 158 m²
- Bedrooms
- 2