- Sold
Laan van Laag Kanje 1 r 718
3951KD Maarn
€ 259.000 k.k.
€ 3.700/m²
Save as favorite
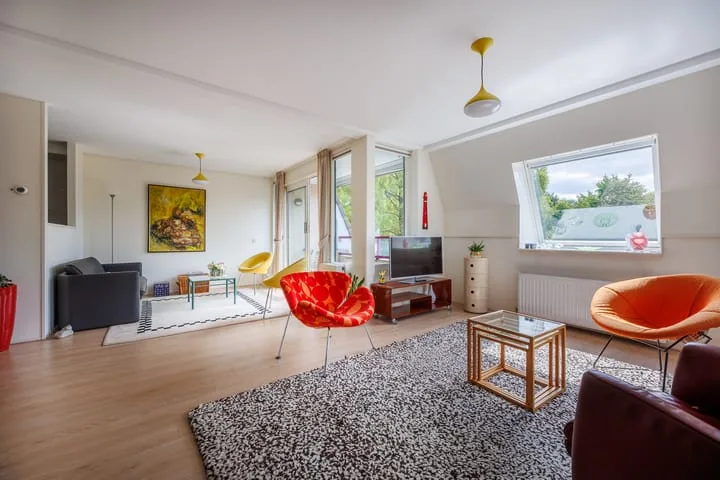
- Living area
- 70 m²
- Land area
- 292 m²
- Bedrooms
- 6