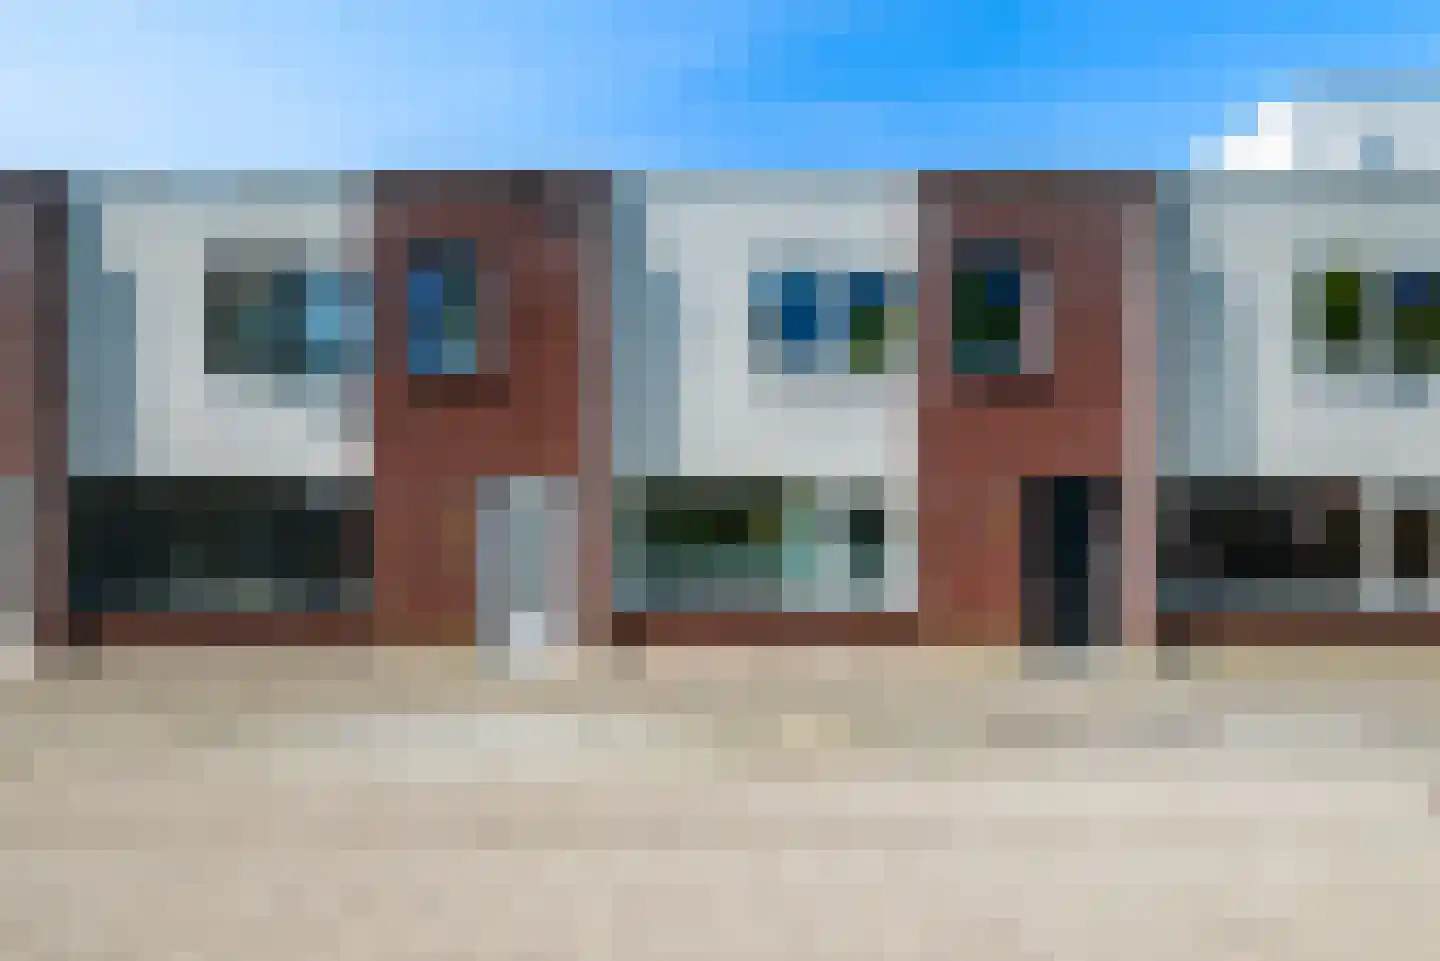
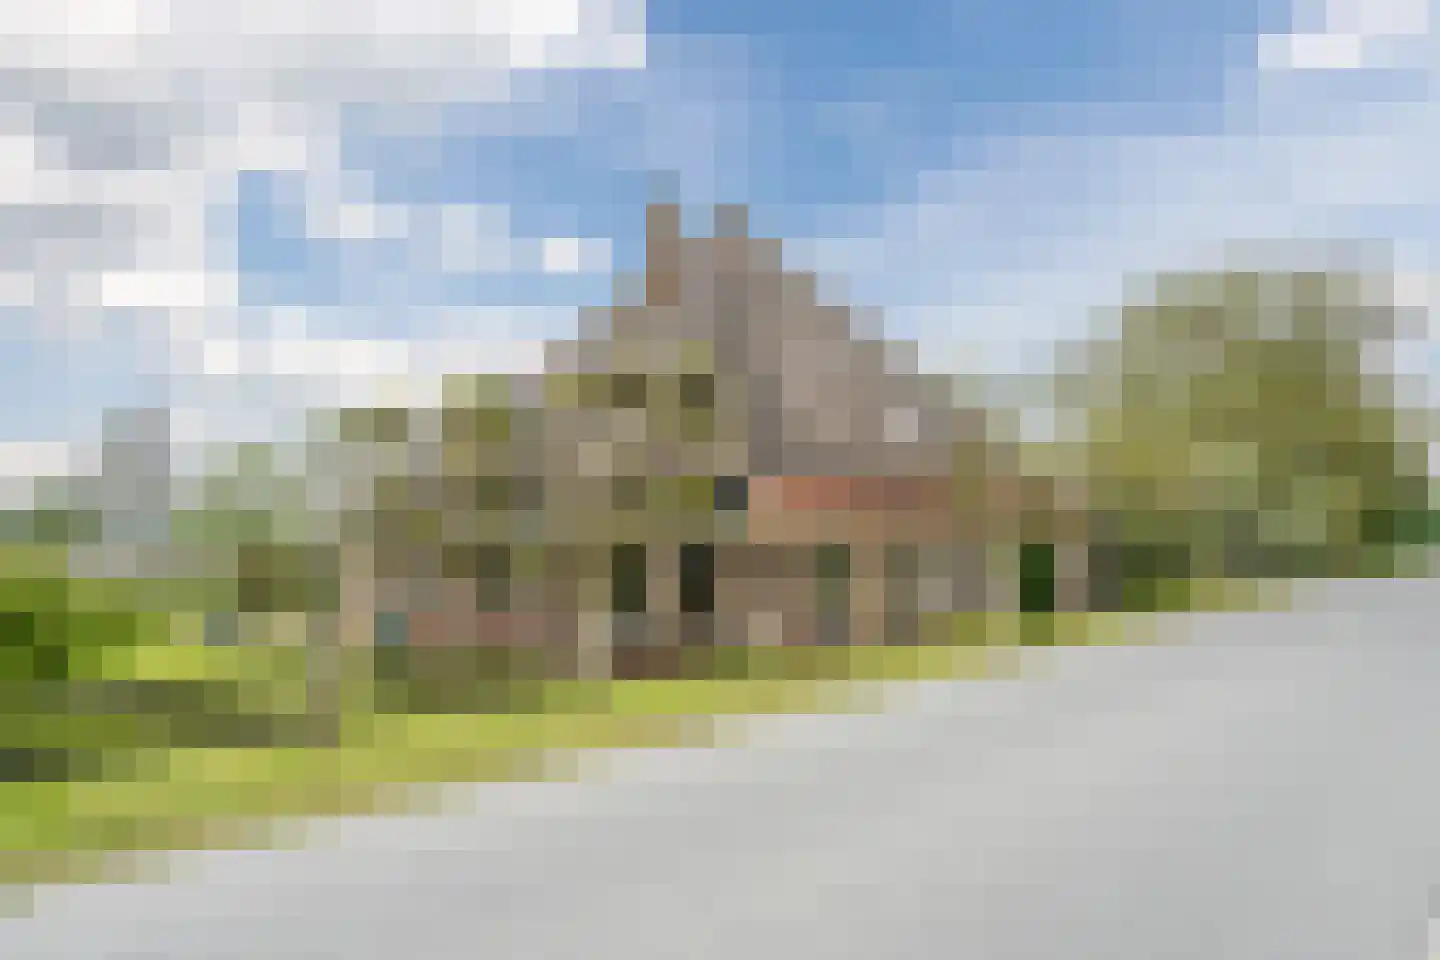
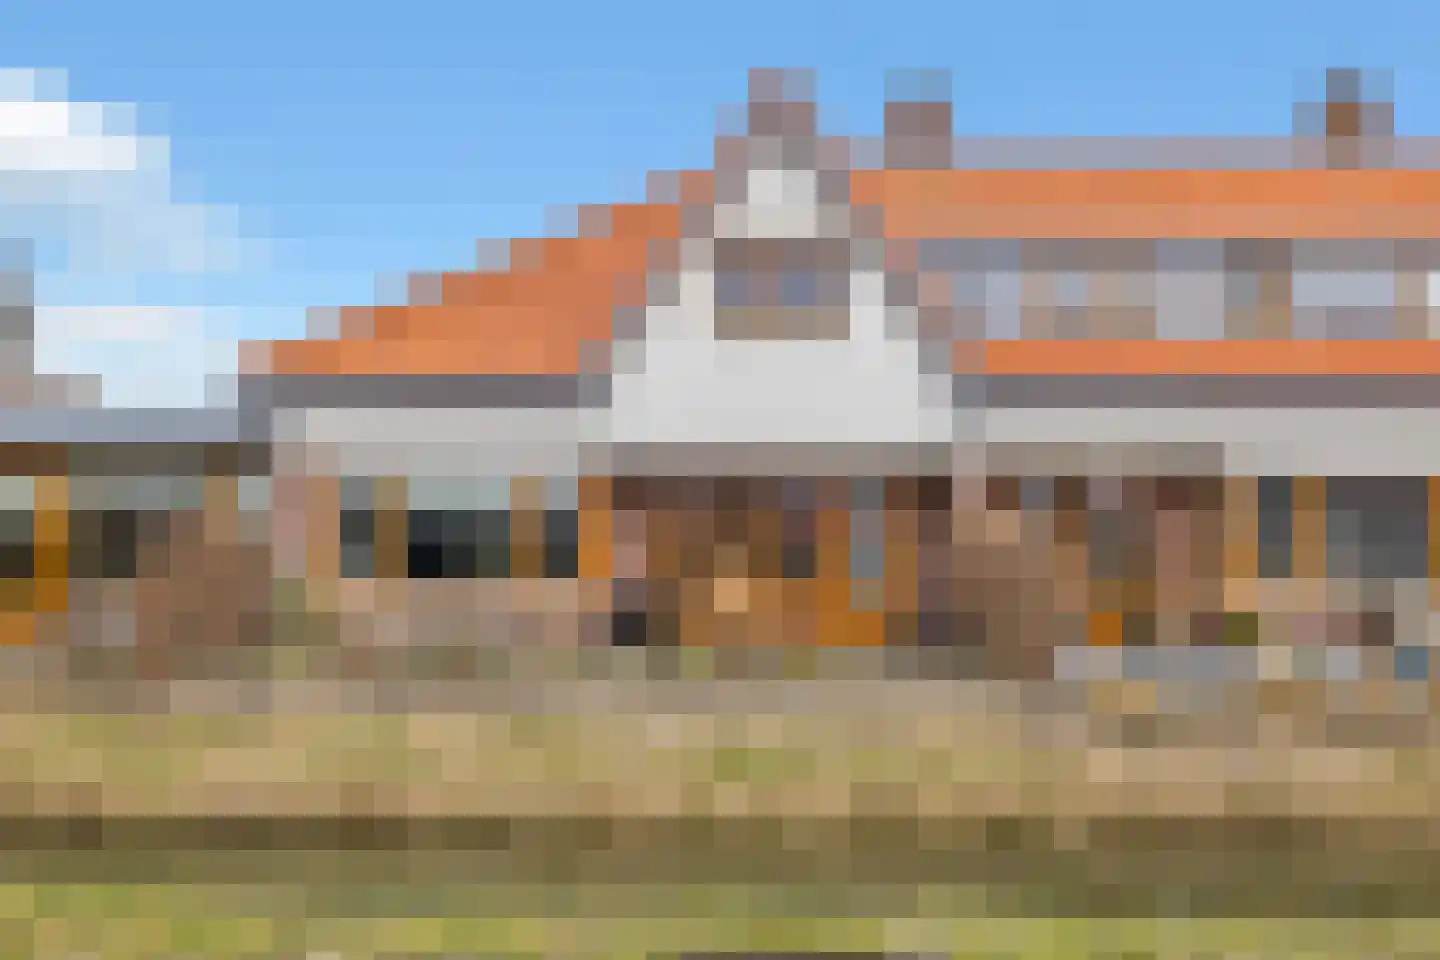
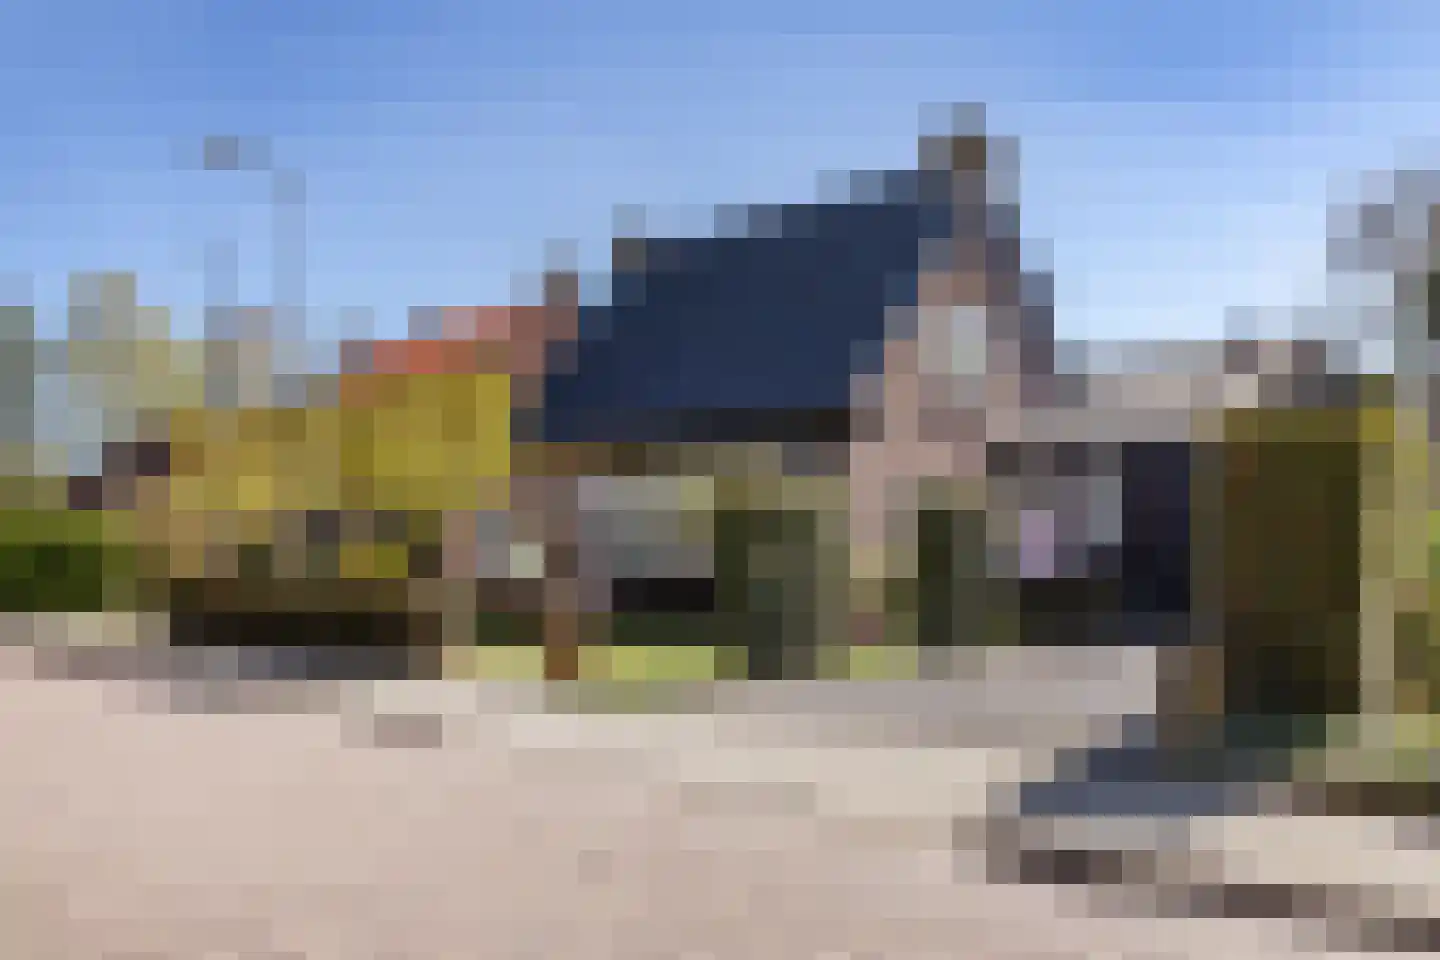
- Available
Dorpsstraat 169
1733AH Nieuwe Niedorp
€ 450.000 k.k.
€ 3.000/m²
- Living area
- 150 m²
- Land area
- 207 m²
- Bedrooms
- 4
Searching in 39 houses in Nieuwe Niedorp
Type to search. Use arrow down and arrow up to navigate through results and press Enter to open.
Hidden search suggestions.
View current properties in Nieuwe Niedorp or search targeted on street, postal code and property characteristics.
View the current housing stock in Nieuwe Niedorp and quickly filter by price, living area, rooms and more. There are currently 39 houses in this place within our selection. View also 22 sold houses in Nieuwe Niedorp for extra insight into the local housing market.
1733AH Nieuwe Niedorp
€ 450.000 k.k.
€ 3.000/m²
1733BA Nieuwe Niedorp
€ 339.000 k.k.
€ 3.942/m²
1733ME Nieuwe Niedorp
€ 1.395.000 k.k.
€ 3.514/m²
1733AS Nieuwe Niedorp
€ 197.500 k.k.
1733AC Nieuwe Niedorp
€ 495.000 k.k.
€ 4.091/m²
1733BA Nieuwe Niedorp
€ 449.000 k.k.
€ 3.402/m²
1733KA Nieuwe Niedorp
€ 575.000 k.k.
€ 3.142/m²
1733JB Nieuwe Niedorp
€ 550.000 k.k.
€ 3.333/m²
1733VK Nieuwe Niedorp
€ 339.000 k.k.
€ 4.775/m²
1733EA Nieuwe Niedorp
€ 975.000 k.k.
€ 3.824/m²
1733JB Nieuwe Niedorp
€ 399.000 k.k.
€ 4.534/m²
1733AS Nieuwe Niedorp
€ 197.500 k.k.
€ 3.464/m²
1733NE Nieuwe Niedorp
€ 62.950
€ 1.890/m²
1733VK Nieuwe Niedorp
€ 450.000 k.k.
€ 4.167/m²
1733AD Nieuwe Niedorp
€ 875.000 k.k.
€ 5.469/m²
1733AW Nieuwe Niedorp
€ 365.000 k.k.
€ 4.011/m²
1733AA Nieuwe Niedorp
€ 639.000 k.k.
€ 5.557/m²
1733PJ Nieuwe Niedorp
€ 575.000 k.k.
€ 4.291/m²
1733PA Nieuwe Niedorp
€ 465.000 k.k.
€ 3.974/m²
1733AV Nieuwe Niedorp
€ 400.000 k.k.
€ 3.333/m²
1733EW Nieuwe Niedorp
€ 995.000 k.k.
€ 6.337/m²
1733PA Nieuwe Niedorp
€ 399.000 k.k.
€ 4.113/m²
1733AN Nieuwe Niedorp
€ 1.000.000 k.k.
€ 4.098/m²
1733PA Nieuwe Niedorp
€ 445.000 k.k.
€ 4.450/m²
1733PJ Nieuwe Niedorp
€ 560.000 k.k.
€ 3.522/m²
1733PJ Nieuwe Niedorp
€ 597.500 k.k.
€ 3.414/m²
1733VD Nieuwe Niedorp
€ 435.000 k.k.
€ 6.127/m²
1733AW Nieuwe Niedorp
€ 475.000 k.k.
€ 5.277/m²
Get free quotes from real estate agents with local market knowledge. Compare more than 39 real estate agents in Nieuwe Niedorp.
Selling a home in Nieuwe Niedorp? View the sales-oriented guide sell a house in Nieuwe Niedorp, compare all real estate agents in Nieuwe Niedorp or view the top 10 real estate agents in Nieuwe Niedorp for extra context to your choice.
Real estate agents make sharper offers when they know you're comparing — ask for quotes for sale or purchase.
Practical answers about housing supply, sales and comparing real estate agents in Nieuwe Niedorp.
The costs of a real estate agent in Nieuwe Niedorp depend on commission, setup costs, property presentation and the chosen service. Compare the 39 real estate agents in Nieuwe Niedorp via the real estate agent page and request multiple quotes to compare rates and approach well.
Within our selection, we are currently showing 39 houses in Nieuwe Niedorp. View also the sold houses in Nieuwe Niedorp to compare the current offering with recent transactions.
Take into account not only price and living area but also maintenance, energy label, location, outdoor space and sales status. This way you compare houses in Nieuwe Niedorp on more than just the asking price.
A local real estate agent knows the neighborhoods, recent transactions and demand in Nieuwe Niedorp. By comparing 39 real estate agents in the region you get a better insight into prices, sales strategy and expected yield; the top 10 in Nieuwe Niedorp provides a useful starting point.
Yes, when making a sales plan, a valuation in Nieuwe Niedorp is wise. You gain insight into a realistic asking price and can then compare offers from real estate agents specifically.
View current location data on residents, WOZ development, housing stock, energy consumption, business activity and safety in Nieuwe Niedorp. In 2025 were there 3.270 residents. The average WOZ value in 2025 is EUR 408.000.
These figures help to better assess and compare the housing stock in Nieuwe Niedorp with recent sold homes. Orient yourself then on suitable top real estate agents in Nieuwe Niedorp for sales advice in this region.
Residents
3.270
Last year: 2025
Average WOZ
EUR 408.000
Last year: 2025
Average income per person.
EUR 36.300
Source: AllNumbers
Crimes (current year)
96
Total registered
| Year | Residents |
|---|---|
| 2021 | 3.300 |
| 2022 | 3.300 |
| 2023 | 3.320 |
| 2024 | 3.320 |
| 2025 | 3.270 |
| Year | Average WOZ |
|---|---|
| 2021 | EUR 280.000 |
| 2022 | EUR 317.000 |
| 2023 | EUR 360.000 |
| 2024 | EUR 389.000 |
| 2025 | EUR 408.000 |
Hoger
610
Praktisch
690
Middelbaar
1.120
Europa
180
Nederland
2.950
Buiten Europa
140
Label A
432
Label B
356
Label C
288
Label G
178
Label D
108
Label F
52
Label A+
27
Label A++
26
Label E
25
Label A+++
12
Label A++++
7
Label A+++++
1
| Year | Gas (m3) | Electricity (kWh) |
|---|---|---|
| 2020 | 1.358 | 3.152 |
| 2021 | 1.470 | 3.110 |
| 2022 | 1.140 | 2.910 |
| 2023 | 980 | 2.770 |
| 2024 | 930 | 2.830 |
Hoekwoning
Gas: 960 • Electricity: 2.630
Huurwoning
Gas: 730 • Electricity: 2.010
Koopwoning
Gas: 1.060 • Electricity: 3.040
Appartement
Gas: 560 • Electricity: 1.760
Tussenwoning
Gas: 820 • Electricity: 2.370
Vrijstaande woning
Gas: 1.270 • Electricity: 3.680
Twee-onder-één-kap woning
Gas: 1.030 • Electricity: 2.640
Total number of company establishments: 530
| Period | Crimes |
|---|---|
| jan 2025 | 4 |
| jan 2026 | 4 |
| jul 2025 | 19 |
| jun 2025 | 4 |
| mei 2025 | 7 |
| mrt 2025 | 4 |
| nov 2024 | 5 |
| nov 2025 | 6 |
| okt 2024 | 6 |
| okt 2025 | 3 |
| sep 2024 | 7 |
| sep 2025 | 8 |
These figures give an indicative picture of safety trends in the living environment of Nieuwe Niedorp.
Short answers based on current local statistics, handy for a quick comparison of the living environment.
Nieuwe Niedorp telt in 2025 ongeveer 3.270 inwoners.
De gemiddelde WOZ-waarde in Nieuwe Niedorp is in 2025 circa € 408.000.
Het gemiddelde inkomen per inwoner in Nieuwe Niedorp ligt rond € 36.300 per jaar.
Voor het huidige jaar gaat het om ongeveer 96 geregistreerde misdrijven. Gebruik deze cijfers als indicatie en vergelijk trends per periode.
In Nieuwe Niedorp komt vooral "Vrijstaande woningen" veel voor, met ongeveer 496 woningen.