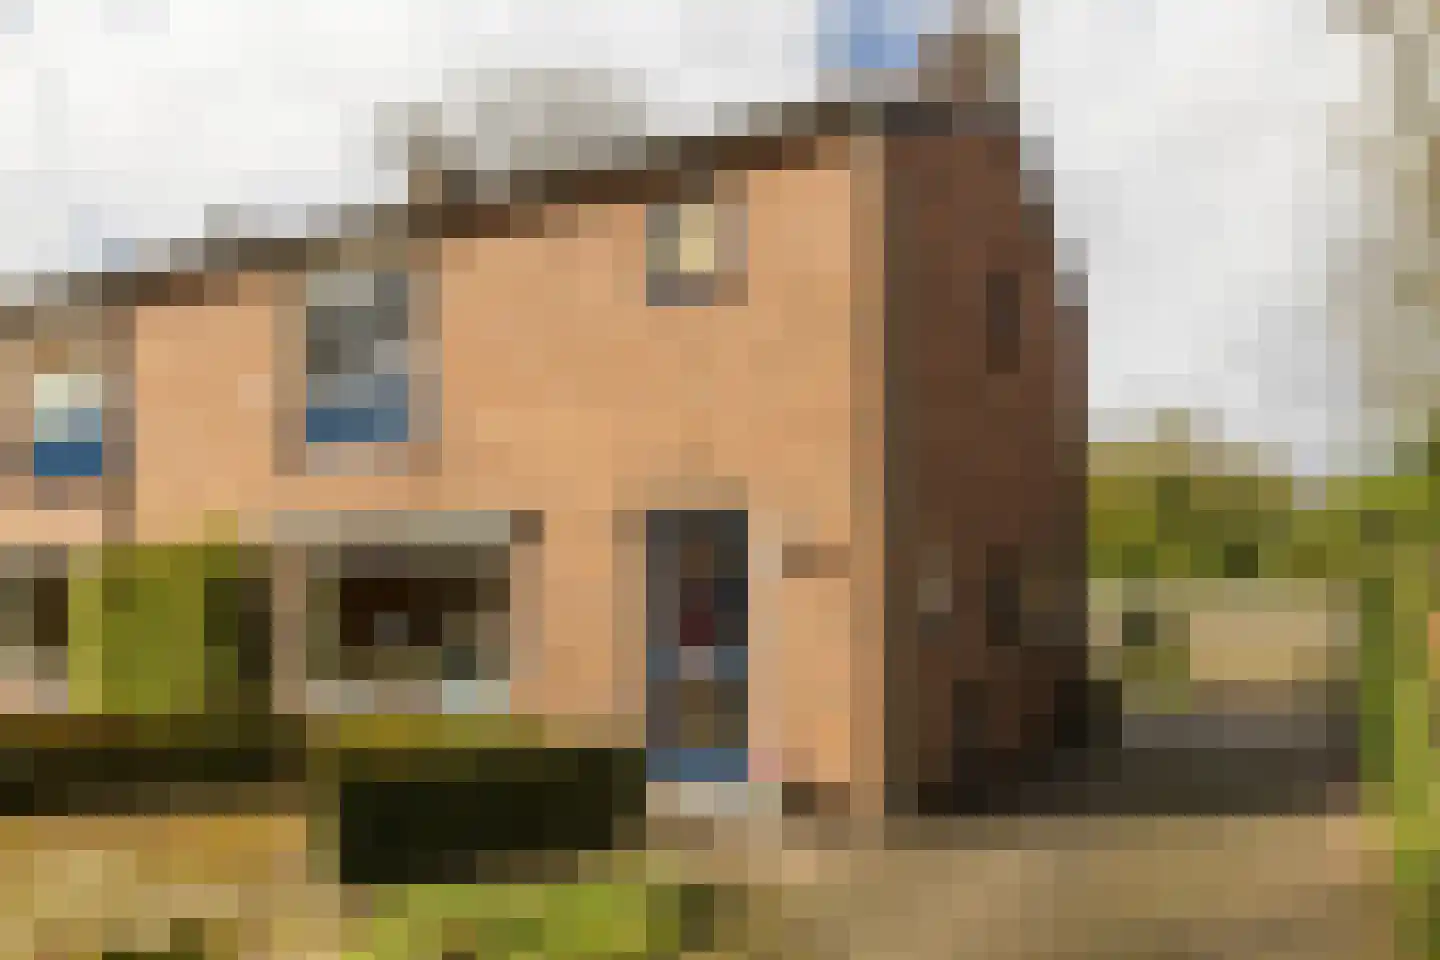
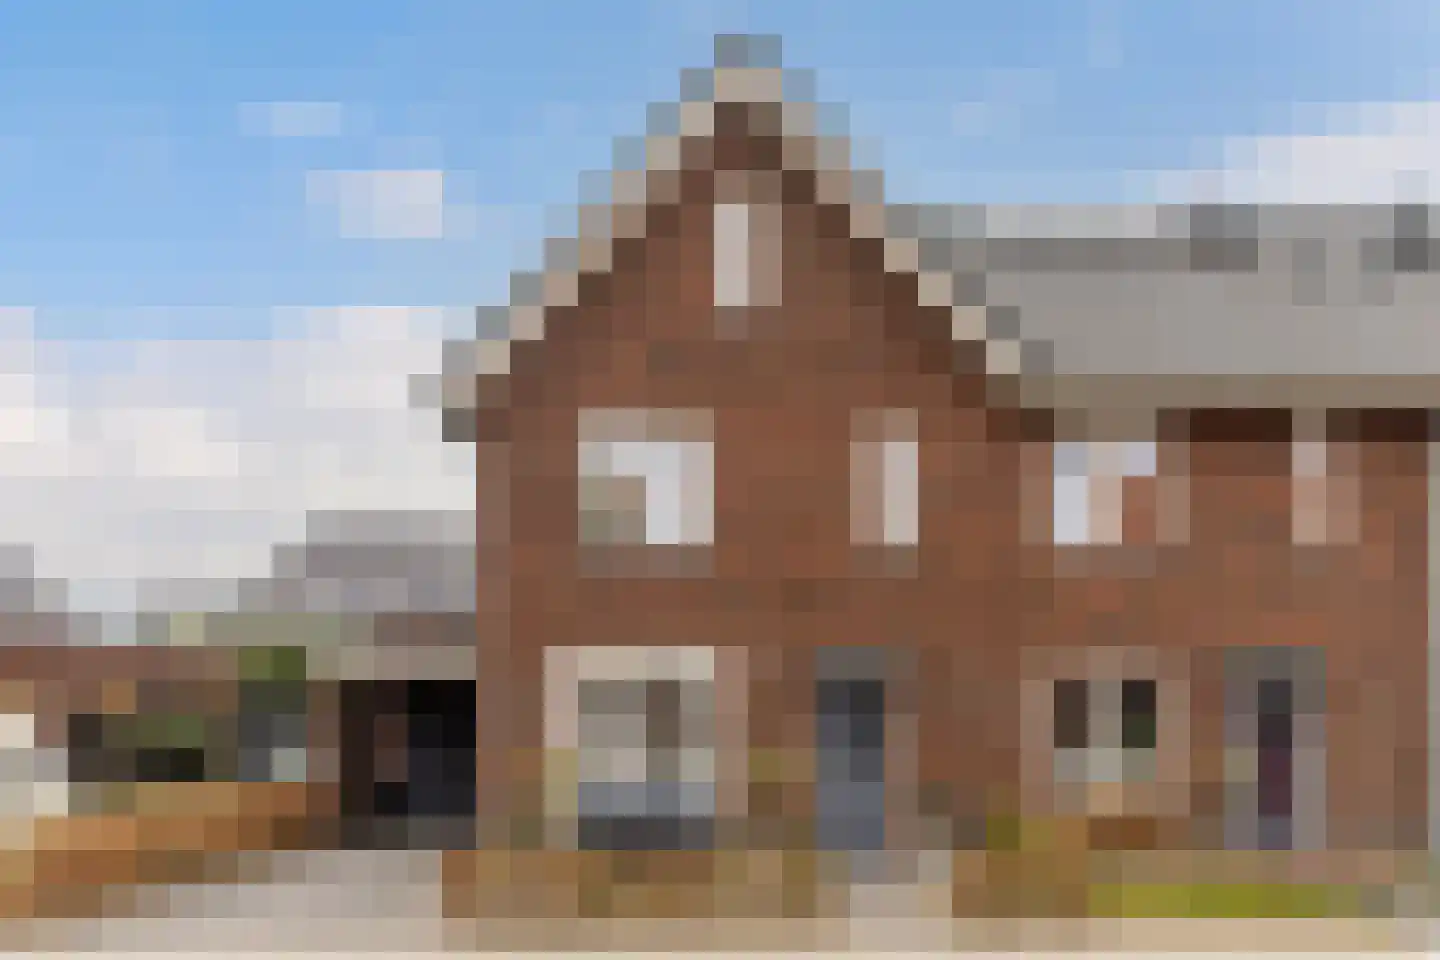
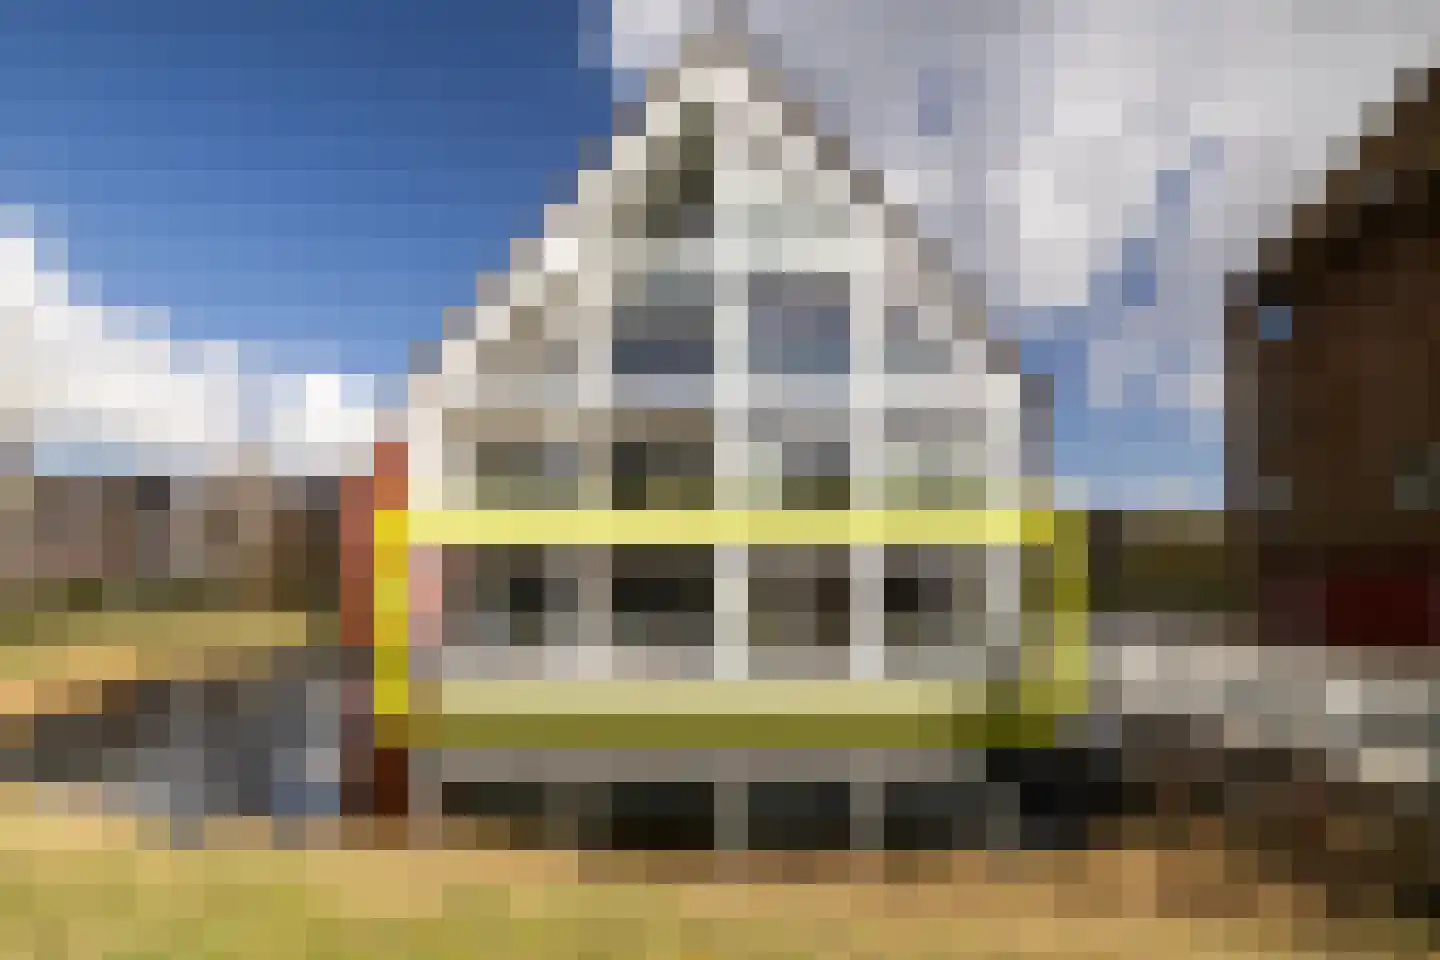
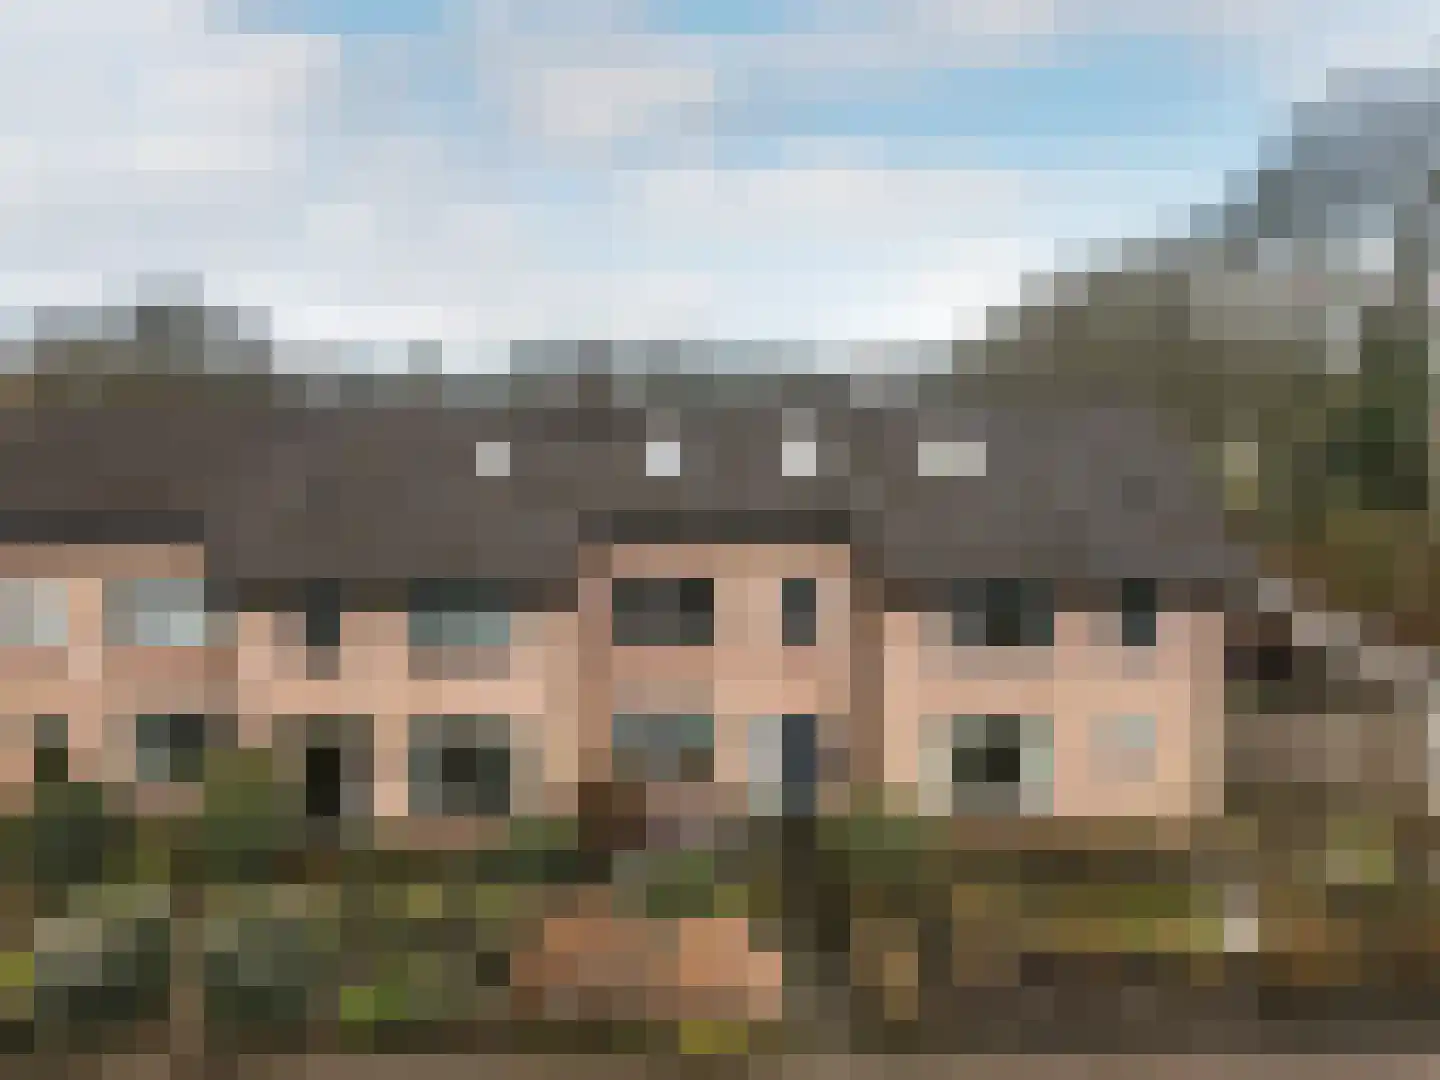
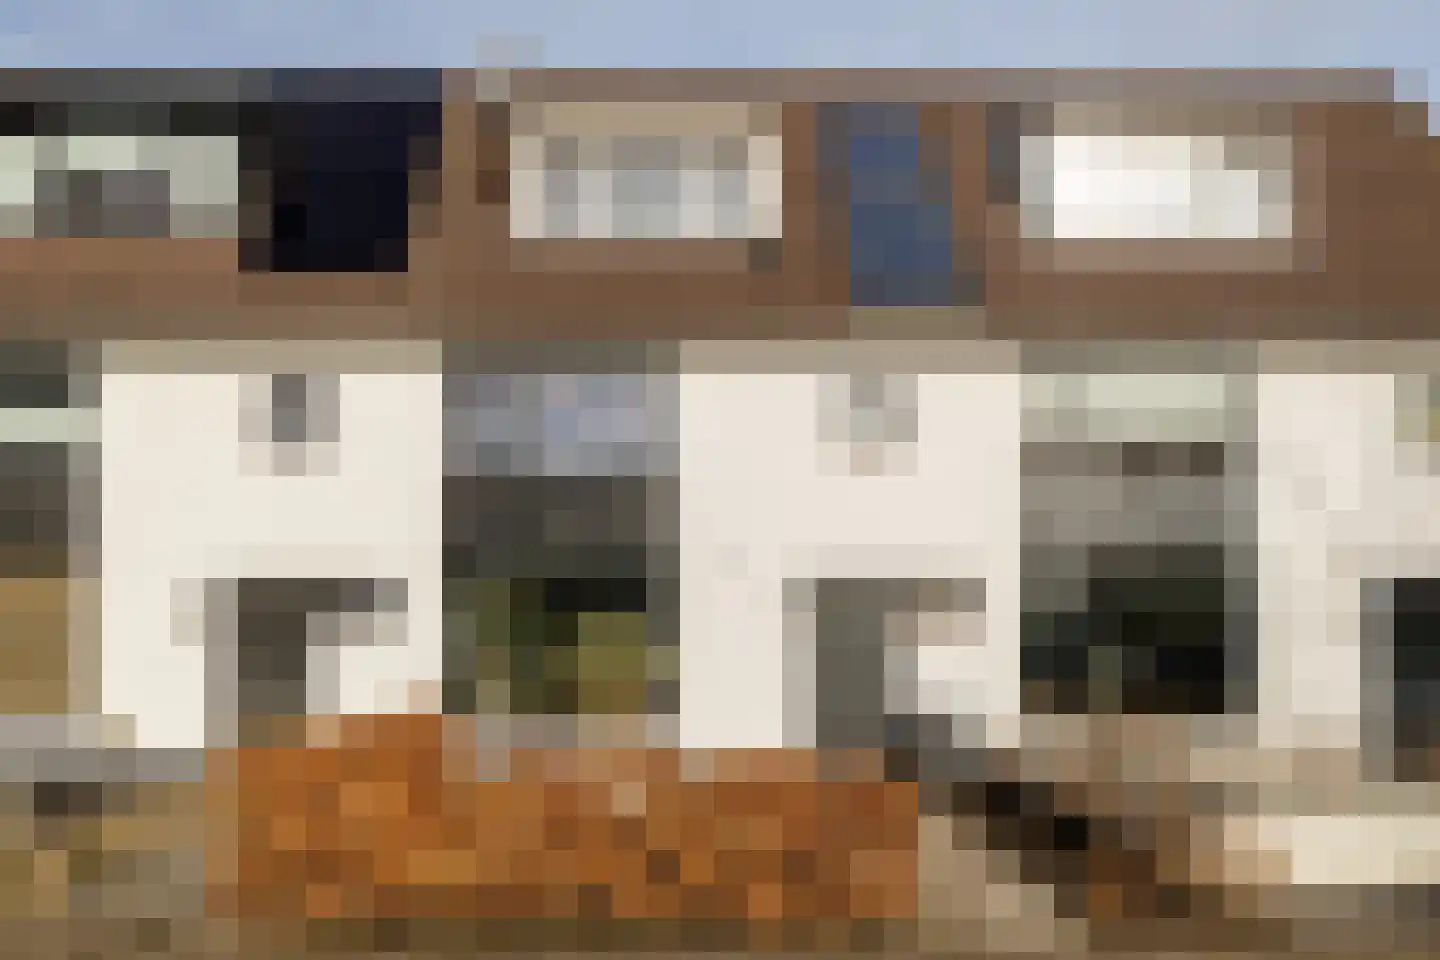
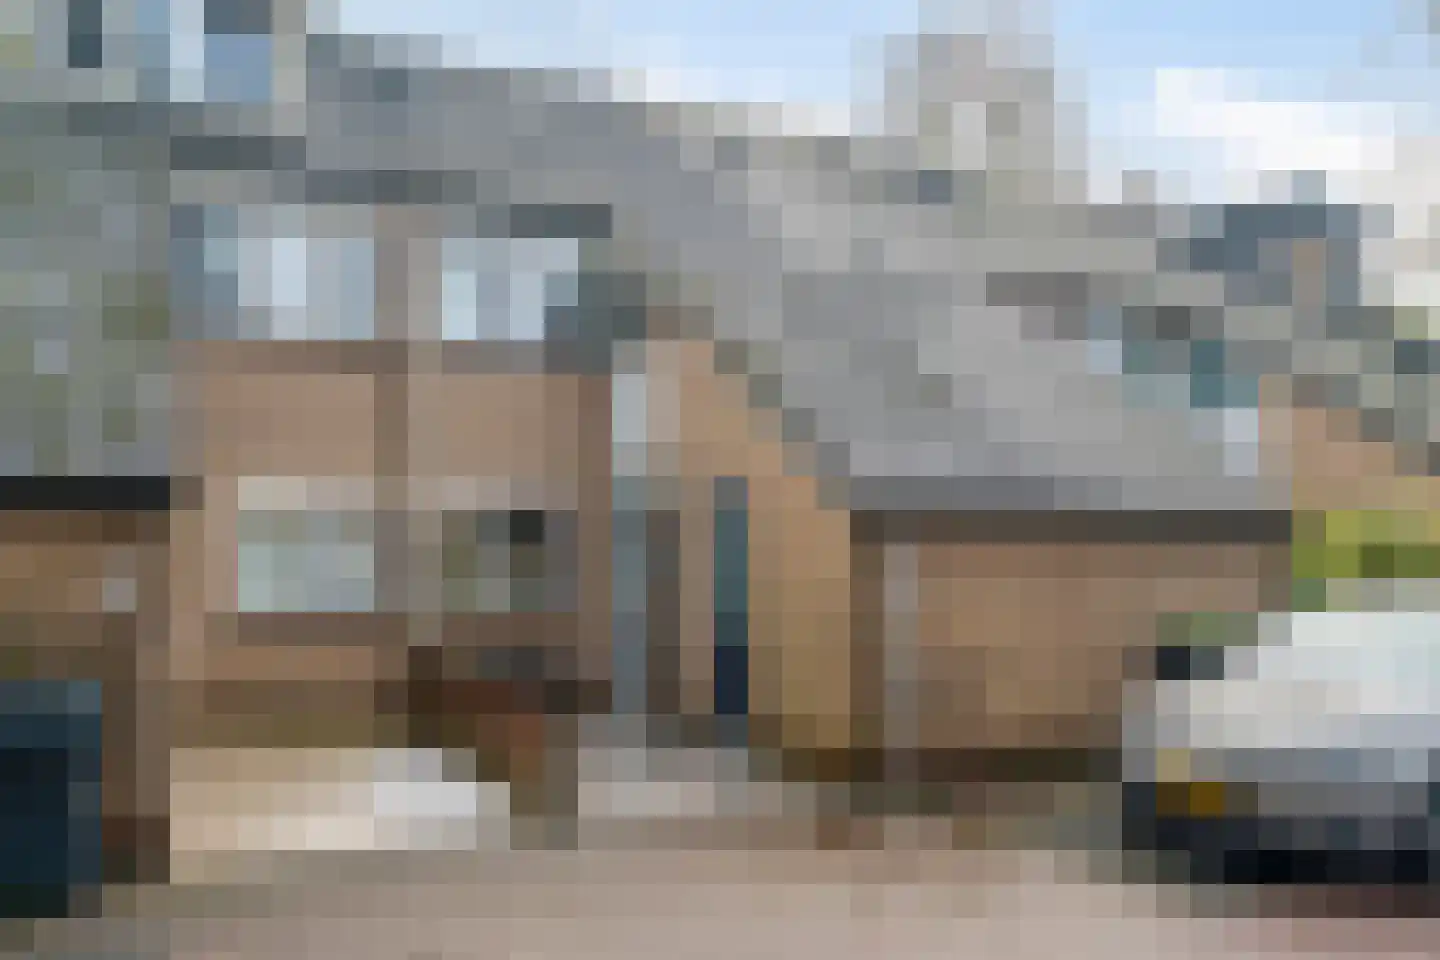
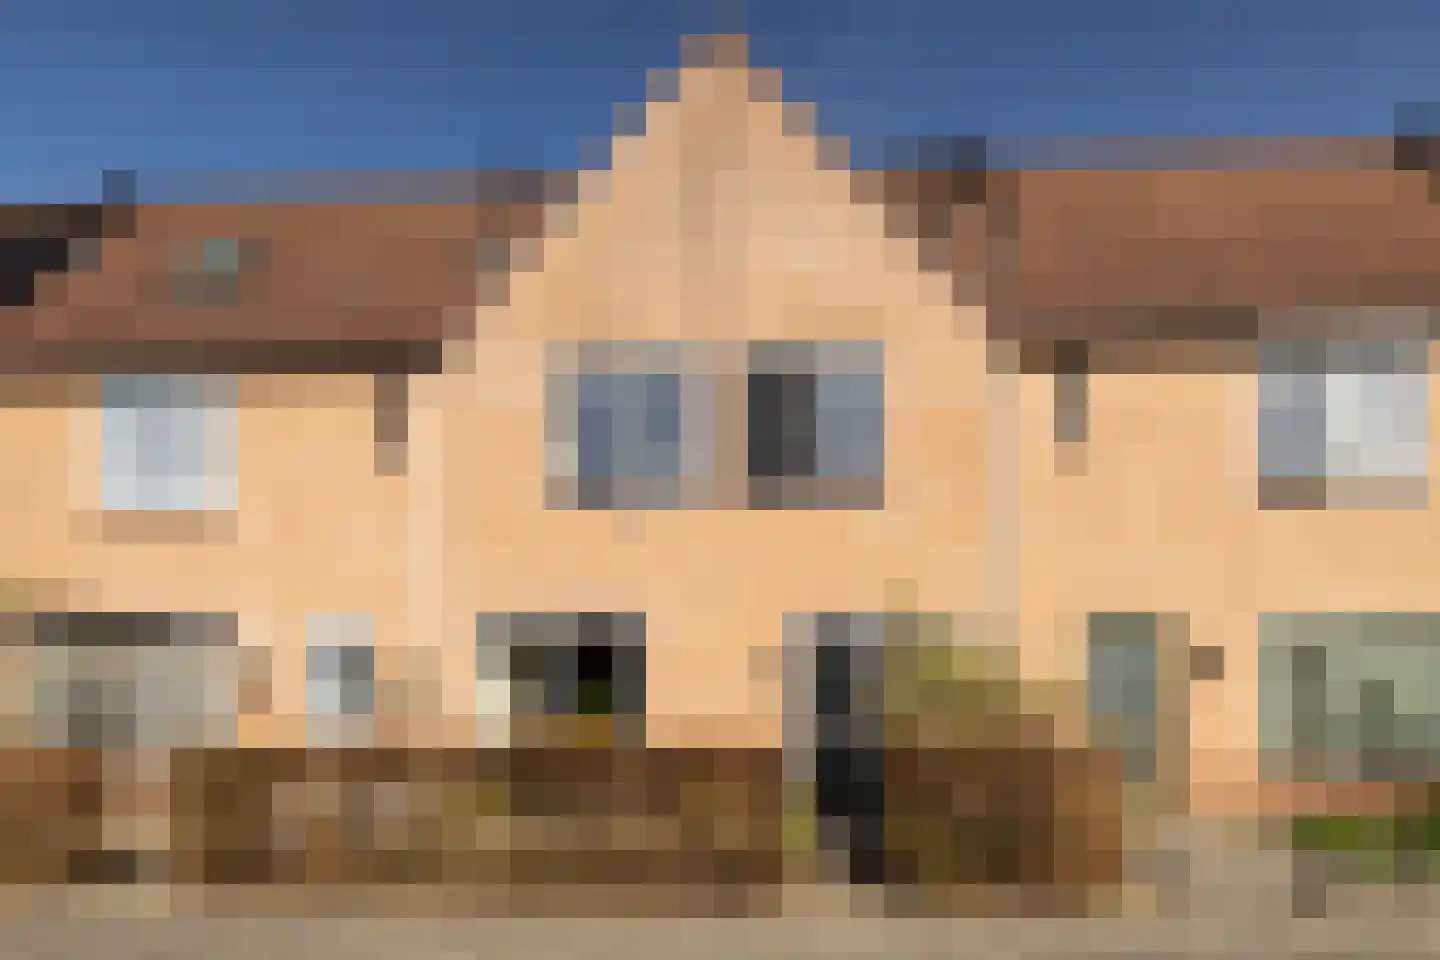
Houses sold in Nunspeet

View 184 sold houses in Nunspeet

Connected to: Vastgoed Nederland NVM Makelaars

On this page you will find recently sold homes in Nunspeet. Use this overview to better estimate selling prices, popular neighborhoods, and the local housing supply before you choose a real estate agent. Also view the current housing supply with 253 houses in Nunspeet.

Selection

Search and filter homes

Set your preferences and discover homes that suit you.

Total supply 242.172
Filters

Set price, area and other characteristics. Adjust a filter or click on Show homes. Location changes directly above.

Reset filters

You search for

  • Place Nunspeet
  • Status Sold

Huis verkopen in Nunspeet? Vergelijk verkoopmakelaars

Bekijk recente verkopen en ontvang gratis offertes van lokale makelaars. Vergelijk meer dan 23 makelaars in Nunspeet.

Free request a quote

  • Quotes in Nunspeet
  • Non-binding
  • Personal
  • Compare free rates

Recent verkocht in Nunspeet? Lees de verkoopgerichte gids huis verkopen in Nunspeet, vergelijk verkoopmakelaars in Nunspeet of bekijk de beste verkoopmakelaars in Nunspeet voor referentie bij jouw keuze.

Vergelijk meerdere offertes

Makelaars maken scherpere voorstellen als ze weten dat je vergelijkt — vraag offertes aan voor verkoop of aankoop.

Frequently asked questions about sold homes in Nunspeet

Short answers about housing prices, sold homes and comparing real estate agents in Nunspeet.

Residential and neighborhood statistics in Nunspeet

View current location data on residents, WOZ development, housing stock, energy consumption, business activity and safety in Nunspeet. In 2026 were there 21.692 residents. The average WOZ value in 2025 is EUR 421.313.

These figures help to better assess and compare the housing stock in Nunspeet with recent sold homes. Orient yourself then on suitable top real estate agents in Nunspeet for sales advice in this region.

Residents

21.692

Last year: 2026

Average WOZ

EUR 421.313

Last year: 2025

Average income per person.

EUR 30.460

Source: AllNumbers

Crimes (current year)

725

Total registered

Demographics and WOZ development

Inhabitants per year

Inhabitants per year in Nunspeet
Year Residents
2021 20.520
2022 20.640
2023 21.030
2024 21.235
2025 21.505
2026 21.692

Annual WOZ value

WOZ value per year in Nunspeet
Year Average WOZ
2021 EUR 296.910
2022 EUR 328.274
2023 EUR 371.395
2024 EUR 398.051
2025 EUR 421.313

Composition of residents

Age build-up

65+: 5.070 0-15: 3.865 15-25: 2.500 25-45: 4.965 45-65: 5.315

Education level

Hoger

3.620

Praktisch

4.720

Middelbaar

6.810

Origin of residents (2025)

Europa

790

Nederland

19.200

Buiten Europa

1.525

Housing stock and construction periods

Types of homes

Hoekwoningen 1.693
Appartementen 1.900
Tussenwoningen 2.729
Vrijstaande woningen 1.636
Twee-onder-één-kap woningen 1.224

Construction period of buildings

Voor 1700 3
1700 tot 1900 113
1900 tot 1925 255
1925 tot 1950 549
1950 tot 1970 2.452
1970 tot 1980 1.879
1980 tot 1990 1.219
1990 tot 2000 745
2000 tot 2010 613
2010 tot 2020 771
2020 en later 437

Energy and sustainability

Energy label distribution

Label C

2.720

Label A

2.625

Label B

1.428

Label D

757

Label G

478

Label F

427

Label E

364

Label A+++

300

Label A++

252

Label A+

138

Label A++++

23

Label A+++++

6

Average energy consumption per year

Average energy consumption per year in Nunspeet
Year Gas (m3) Electricity (kWh)
2020 1.275 2.928
2021 1.417 2.978
2022 1.122 2.809
2023 925 2.659
2024 896 2.751

Consumption per house type

Hoekwoning

Gas: 877 • Electricity: 2.680

Huurwoning

Gas: 742 • Electricity: 2.036

Koopwoning

Gas: 1.045 • Electricity: 3.028

Appartement

Gas: 662 • Electricity: 1.867

Tussenwoning

Gas: 787 • Electricity: 2.349

Vrijstaande woning

Gas: 1.394 • Electricity: 3.623

Twee-onder-één-kap woning

Gas: 1.069 • Electricity: 3.069

Business activity in Nunspeet (2025)

Handel en HORECA 535
Nijverheid en energie 505
Zakelijke dienstverlening 635
Overheid, onderwijs en zorg 395
Landbouw, bosbouw en visserij 70
Vervoer, informatie en communicatie 160
Financiele diensten en onroerendgoed 195
Cultuur, recreatie en overige diensten 225

Total number of company establishments: 2.730

Recent crime statistics

Recent crime statistics in Nunspeet
Period Crimes
jan 2026 45
jul 2025 69
jun 2025 70
mei 2025 39
mrt 2025 73
mrt 2026 72
nov 2024 63
nov 2025 70
okt 2024 49
okt 2025 64
sep 2024 60
sep 2025 70

These figures give an indicative picture of safety trends in the living environment of Nunspeet.

Frequently asked questions about living in Nunspeet

Short answers based on current local statistics, handy for a quick comparison of the living environment.

Hoeveel inwoners heeft Nunspeet?

Nunspeet telt in 2026 ongeveer 21.692 inwoners.

Wat is de gemiddelde WOZ-waarde in Nunspeet?

De gemiddelde WOZ-waarde in Nunspeet is in 2025 circa € 421.313.

Wat is het gemiddelde inkomen per inwoner in Nunspeet?

Het gemiddelde inkomen per inwoner in Nunspeet ligt rond € 30.460 per jaar.

Hoe veilig is wonen in Nunspeet?

Voor het huidige jaar gaat het om ongeveer 725 geregistreerde misdrijven. Gebruik deze cijfers als indicatie en vergelijk trends per periode.

Welke woningtypen komen het meest voor in Nunspeet?

In Nunspeet komt vooral "Tussenwoningen" veel voor, met ongeveer 2.729 woningen.

Receive free, non-binding quotes

Compare multiple real estate agents and choose the best match.