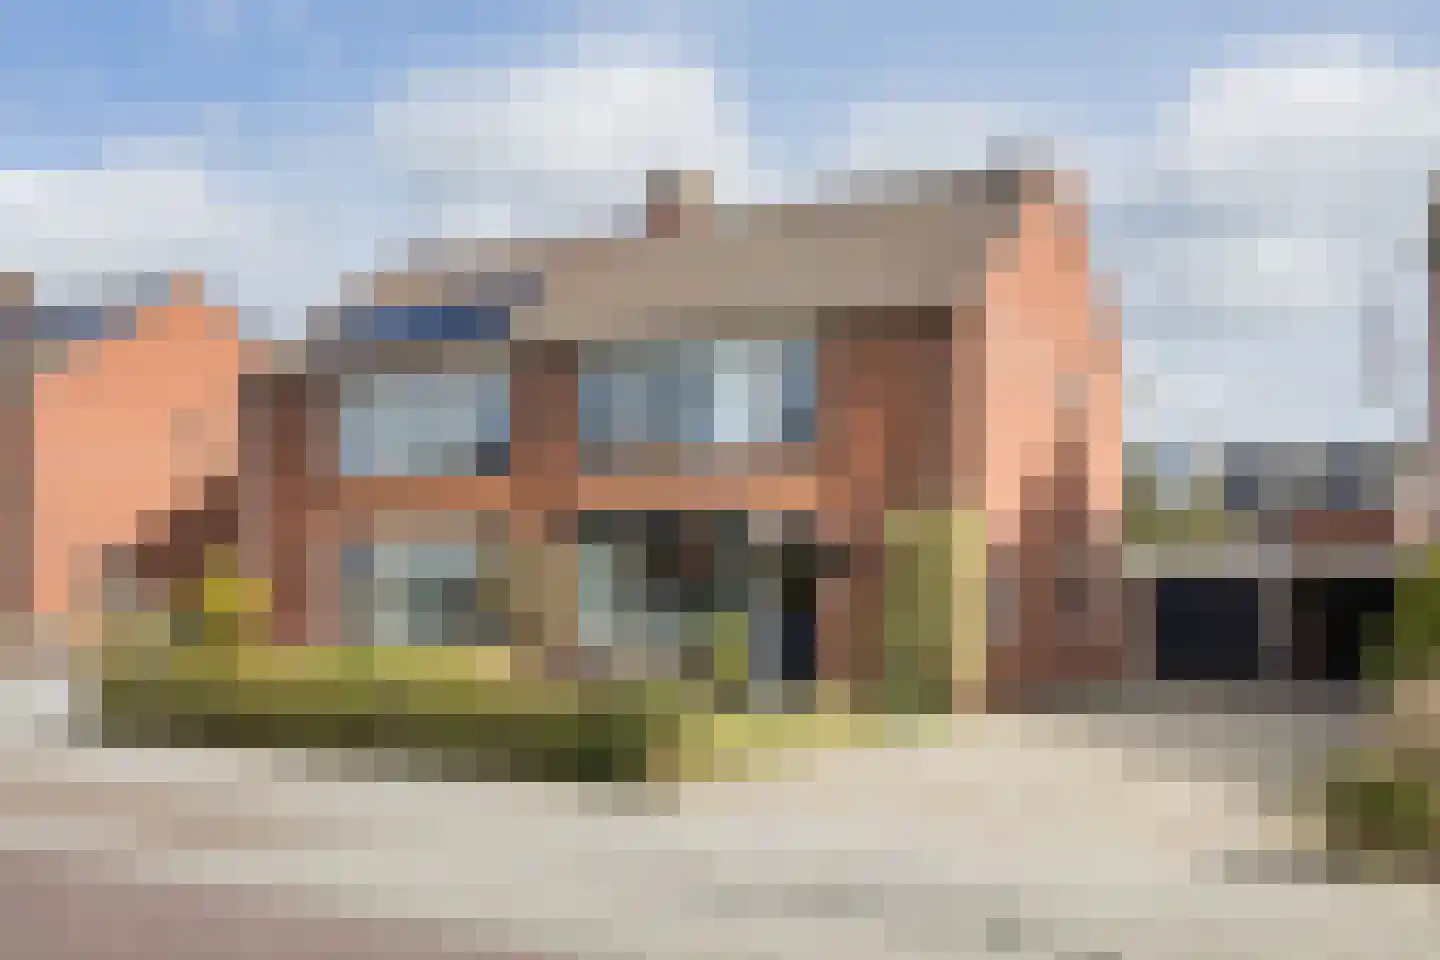
- Available
Kerkplein 1 A
7631EV Ootmarsum
€ 795.000 k.k.
€ 5.372/m²
- Living area
- 148 m²
- Land area
- —
- Bedrooms
- 2
Searching in 48 houses in Ootmarsum
Type to search. Use arrow down and arrow up to navigate through results and press Enter to open.
Hidden search suggestions.
View current properties in Ootmarsum or search targeted on street, postal code and property characteristics.
View the current housing stock in Ootmarsum and quickly filter by price, living area, rooms and more. There are currently 48 houses in this place within our selection. View also 37 sold houses in Ootmarsum for extra insight into the local housing market.
7631EV Ootmarsum
€ 795.000 k.k.
€ 5.372/m²
7631AD Ootmarsum
€ 947.500 k.k.
€ 3.408/m²
7631DE Ootmarsum
€ 789.000 k.k.
€ 3.887/m²
7631JJ Ootmarsum
€ 569.000 k.k.
€ 3.951/m²
7631GN Ootmarsum
€ 636.000 k.k.
7631EV Ootmarsum
€ 598.000 k.k.
€ 3.417/m²
7631EV Ootmarsum
€ 895.000 k.k.
€ 5.594/m²
7631AW Ootmarsum
€ 649.000 k.k.
€ 3.646/m²
7631LG Ootmarsum
€ 895.000 k.k.
€ 4.761/m²
7631AB Ootmarsum
€ 569.000 k.k.
€ 3.601/m²
7631CS Ootmarsum
€ 475.000 k.k.
7631BM Ootmarsum
€ 398.000 k.k.
€ 3.827/m²
7631ED Ootmarsum
€ 349.000 k.k.
€ 3.116/m²
7631HP Ootmarsum
€ 425.000 k.k.
€ 2.891/m²
7631HE Ootmarsum
€ 339.000 k.k.
€ 3.260/m²
7631DE Ootmarsum
€ 595.000 k.k.
€ 4.131/m²
7631BC Ootmarsum
€ 525.000 k.k.
€ 4.525/m²
7631GA Ootmarsum
€ 405.000 k.k.
€ 4.655/m²
7631HP Ootmarsum
€ 364.000 k.k.
€ 3.956/m²
7631CM Ootmarsum
€ 795.000 k.k.
€ 3.369/m²
7631BG Ootmarsum
€ 425.000 k.k.
€ 3.244/m²
7631HB Ootmarsum
€ 350.000 k.k.
€ 3.571/m²
7631JN Ootmarsum
€ 449.000 k.k.
€ 3.563/m²
7631EC Ootmarsum
€ 335.000 k.k.
€ 3.383/m²
7631LA Ootmarsum
€ 489.000 k.k.
€ 3.732/m²
7631AC Ootmarsum
€ 429.000 k.k.
€ 4.564/m²
7631BT Ootmarsum
€ 498.000 k.k.
€ 2.878/m²
7631GM Ootmarsum
€ 444.000 k.k.
€ 3.062/m²
Get free quotes from real estate agents with local market knowledge. Compare more than 15 real estate agents in Ootmarsum.
Selling a home in Ootmarsum? Compare all real estate agents in Ootmarsum or view the top 10 real estate agents in Ootmarsum for extra context for your choice.
Real estate agents make sharper offers when they know you're comparing — ask for quotes for sale or purchase.
Practical answers about housing supply, sales and comparing real estate agents in Ootmarsum.
The costs of a real estate agent in Ootmarsum depend on commission, setup costs, property presentation and the chosen service. Compare the 15 real estate agents in Ootmarsum via the real estate agent page and request multiple quotes to compare rates and approach well.
Within our selection, we are currently showing 48 houses in Ootmarsum. View also the sold houses in Ootmarsum to compare the current offering with recent transactions.
Take into account not only price and living area but also maintenance, energy label, location, outdoor space and sales status. This way you compare houses in Ootmarsum on more than just the asking price.
A local real estate agent knows the neighborhoods, recent transactions and demand in Ootmarsum. By comparing 15 real estate agents in the region you get a better insight into prices, sales strategy and expected yield; the top 10 in Ootmarsum provides a useful starting point.
Yes, when making a sales plan, a valuation in Ootmarsum is wise. You gain insight into a realistic asking price and can then compare offers from real estate agents specifically.
View current location data on residents, WOZ development, housing stock, energy consumption, business activity and safety in Ootmarsum. In 2026 were there 4.608 residents. The average WOZ value in 2025 is EUR 419.000.
These figures help to better assess and compare the housing stock in Ootmarsum with recent sold homes. Orient yourself then on suitable top real estate agents in Ootmarsum for sales advice in this region.
Residents
4.608
Last year: 2026
Average WOZ
EUR 419.000
Last year: 2025
Average income per person.
EUR 36.200
Source: AllNumbers
Crimes (current year)
70
Total registered
| Year | Residents |
|---|---|
| 2021 | 4.450 |
| 2022 | 4.460 |
| 2023 | 4.500 |
| 2024 | 4.490 |
| 2025 | 4.515 |
| 2026 | 4.608 |
| Year | Average WOZ |
|---|---|
| 2021 | EUR 290.000 |
| 2022 | EUR 320.000 |
| 2023 | EUR 359.000 |
| 2024 | EUR 406.000 |
| 2025 | EUR 419.000 |
Hoger
1.080
Praktisch
660
Middelbaar
1.510
Europa
265
Nederland
4.115
Buiten Europa
135
Label C
533
Label A
471
Label B
366
Label D
342
Label F
179
Label G
147
Label E
77
Label A+
55
Label A+++
20
Label A++
17
Label A++++
14
Label A+++++
0
| Year | Gas (m3) | Electricity (kWh) |
|---|---|---|
| 2020 | 1.550 | 3.170 |
| 2021 | 1.870 | 3.210 |
| 2022 | 1.480 | 2.990 |
| 2023 | 1.210 | 2.890 |
| 2024 | 1.160 | 3.040 |
Hoekwoning
Gas: 1.130 • Electricity: 2.750
Huurwoning
Gas: 930 • Electricity: 2.080
Koopwoning
Gas: 1.300 • Electricity: 3.130
Appartement
Gas: 690 • Electricity: 1.860
Tussenwoning
Gas: 1.110 • Electricity: 2.670
Vrijstaande woning
Gas: 1.420 • Electricity: 3.390
Twee-onder-één-kap woning
Gas: 1.170 • Electricity: 2.580
Total number of company establishments: 625
| Period | Crimes |
|---|---|
| jan 2026 | 7 |
| jul 2025 | 8 |
| jun 2025 | 1 |
| mei 2025 | 8 |
| mrt 2025 | 4 |
| mrt 2026 | 7 |
| nov 2024 | 8 |
| nov 2025 | 6 |
| okt 2024 | 9 |
| okt 2025 | 8 |
| sep 2024 | 5 |
| sep 2025 | 4 |
These figures give an indicative picture of safety trends in the living environment of Ootmarsum.
Short answers based on current local statistics, handy for a quick comparison of the living environment.
Ootmarsum telt in 2026 ongeveer 4.608 inwoners.
De gemiddelde WOZ-waarde in Ootmarsum is in 2025 circa € 419.000.
Het gemiddelde inkomen per inwoner in Ootmarsum ligt rond € 36.200 per jaar.
Voor het huidige jaar gaat het om ongeveer 70 geregistreerde misdrijven. Gebruik deze cijfers als indicatie en vergelijk trends per periode.
In Ootmarsum komt vooral "Vrijstaande woningen" veel voor, met ongeveer 970 woningen.