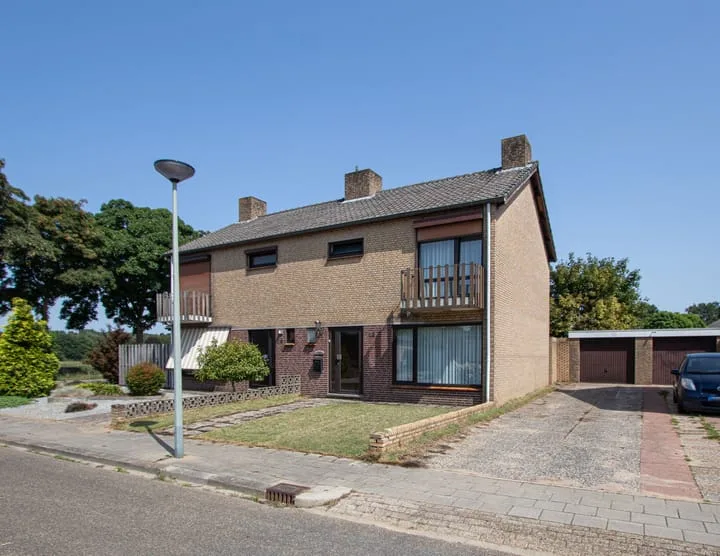
- Available
Tombac 30
6065BP Montfort
€ 350.000 k.k.
€ 3.097/m²
- Living area
- 113 m²
- Land area
- 322 m²
- Bedrooms
- 2
Searching in 25 houses in Montfort
Type to search. Use arrow down and arrow up to navigate through results and press Enter to open.
Hidden search suggestions.
View current properties in Montfort or search targeted on street, postal code and property characteristics.
View the current housing stock in Montfort and quickly filter by price, living area, rooms and more. There are currently 25 houses in this place within our selection. View also 20 sold houses in Montfort for extra insight into the local housing market.
6065BP Montfort
€ 350.000 k.k.
€ 3.097/m²
6065DD Montfort
€ 339.000 k.k.
€ 3.198/m²
6065CZ Montfort
€ 650.000 k.k.
€ 4.167/m²
6065AP Montfort
€ 795.000 k.k.
€ 3.936/m²
6065AL Montfort
€ 309.000 k.k.
€ 2.915/m²
6065BR Montfort
€ 325.000 k.k.
€ 4.062/m²
6065BT Montfort
€ 359.000 k.k.
€ 2.040/m²
6065CW Montfort
€ 850.000 k.k.
€ 2.335/m²
6065CS Montfort
€ 475.000 k.k.
€ 3.442/m²
6065BW Montfort
€ 345.000 k.k.
€ 2.555/m²
6065EH Montfort
€ 745.000 k.k.
€ 3.725/m²
6065ER Montfort
€ 325.000 k.k.
€ 2.708/m²
6065DX Montfort
€ 475.000 k.k.
€ 2.827/m²
6065EN Montfort
€ 595.000 k.k.
€ 2.542/m²
6065BN Montfort
Price upon request
6065CT Montfort
€ 550.000 k.k.
€ 2.941/m²
6065GB Montfort
€ 825.000 k.k.
€ 0/m²
6065BL Montfort
€ 245.000 k.k.
€ 0/m²
6065EN Montfort
€ 595.000 k.k.
€ 2.833/m²
6065EZ Montfort
€ 795.000 k.k.
€ 2.317/m²
6065CC Montfort
€ 369.000 k.k.
€ 3.236/m²
6065AT Montfort
€ 425.000 k.k.
€ 1.880/m²
6065AW Montfort
€ 300.000 k.k.
€ 1.910/m²
6065AC Montfort
€ 499.500 k.k.
€ 2.535/m²
6065BG Montfort
€ 675.000 k.k.
€ 3.835/m²
Get free quotes from real estate agents with local market knowledge. Compare more than 41 real estate agents in Montfort.
Selling a home in Montfort? Compare all real estate agents in Montfort or view the top 10 real estate agents in Montfort for extra context for your choice.
Real estate agents make sharper offers when they know you're comparing — ask for quotes for sale or purchase.
Practical answers about housing supply, sales and comparing real estate agents in Montfort.
The costs of a real estate agent in Montfort depend on commission, setup costs, property presentation and the chosen service. Compare the 41 real estate agents in Montfort via the real estate agent page and request multiple quotes to compare rates and approach well.
Within our selection, we are currently showing 25 houses in Montfort. View also the sold houses in Montfort to compare the current offering with recent transactions.
Take into account not only price and living area but also maintenance, energy label, location, outdoor space and sales status. This way you compare houses in Montfort on more than just the asking price.
A local real estate agent knows the neighborhoods, recent transactions and demand in Montfort. By comparing 41 real estate agents in the region you get a better insight into prices, sales strategy and expected yield; the top 10 in Montfort provides a useful starting point.
Yes, when making a sales plan, a valuation in Montfort is wise. You gain insight into a realistic asking price and can then compare offers from real estate agents specifically.
View current location data on residents, WOZ development, housing stock, energy consumption, business activity and safety in Montfort. In 2026 were there 3.120 residents. The average WOZ value in 2025 is EUR 355.000.
These figures help to better assess and compare the housing stock in Montfort with recent sold homes. Orient yourself then on suitable top real estate agents in Montfort for sales advice in this region.
Residents
3.120
Last year: 2026
Average WOZ
EUR 355.000
Last year: 2025
Average income per person.
EUR 34.400
Source: AllNumbers
Crimes (current year)
66
Total registered
| Year | Residents |
|---|---|
| 2021 | 3.125 |
| 2022 | 3.100 |
| 2023 | 3.110 |
| 2024 | 3.100 |
| 2025 | 3.085 |
| 2026 | 3.120 |
| Year | Average WOZ |
|---|---|
| 2021 | EUR 271.000 |
| 2022 | EUR 288.000 |
| 2023 | EUR 336.000 |
| 2024 | EUR 335.000 |
| 2025 | EUR 355.000 |
Hoger
530
Praktisch
610
Middelbaar
1.180
Europa
235
Nederland
2.735
Buiten Europa
105
Label C
290
Label A
222
Label F
219
Label D
210
Label B
187
Label G
140
Label E
71
Label A+
29
Label A++++
19
Label A++
8
Label A+++
2
Label A+++++
0
| Year | Gas (m3) | Electricity (kWh) |
|---|---|---|
| 2020 | 1.570 | 3.490 |
| 2021 | 1.720 | 3.480 |
| 2022 | 1.340 | 3.310 |
| 2023 | 1.090 | 3.180 |
| 2024 | 1.030 | 3.240 |
Hoekwoning
Gas: 900 • Electricity: 2.620
Huurwoning
Gas: 830 • Electricity: 2.230
Koopwoning
Gas: 1.140 • Electricity: 3.390
Appartement
Gas: 780 • Electricity: 2.220
Tussenwoning
Gas: 870 • Electricity: 2.630
Vrijstaande woning
Gas: 1.270 • Electricity: 3.790
Twee-onder-één-kap woning
Gas: 1.030 • Electricity: 2.880
Total number of company establishments: 395
| Period | Crimes |
|---|---|
| jan 2026 | 11 |
| jul 2025 | 6 |
| jun 2025 | 6 |
| mei 2025 | 3 |
| mrt 2025 | 9 |
| mrt 2026 | 1 |
| nov 2024 | 3 |
| nov 2025 | 2 |
| okt 2024 | 7 |
| okt 2025 | 6 |
| sep 2024 | 1 |
| sep 2025 | 5 |
These figures give an indicative picture of safety trends in the living environment of Montfort.
Short answers based on current local statistics, handy for a quick comparison of the living environment.
Montfort telt in 2026 ongeveer 3.120 inwoners.
De gemiddelde WOZ-waarde in Montfort is in 2025 circa € 355.000.
Het gemiddelde inkomen per inwoner in Montfort ligt rond € 34.400 per jaar.
Voor het huidige jaar gaat het om ongeveer 66 geregistreerde misdrijven. Gebruik deze cijfers als indicatie en vergelijk trends per periode.
In Montfort komt vooral "Vrijstaande woningen" veel voor, met ongeveer 650 woningen.