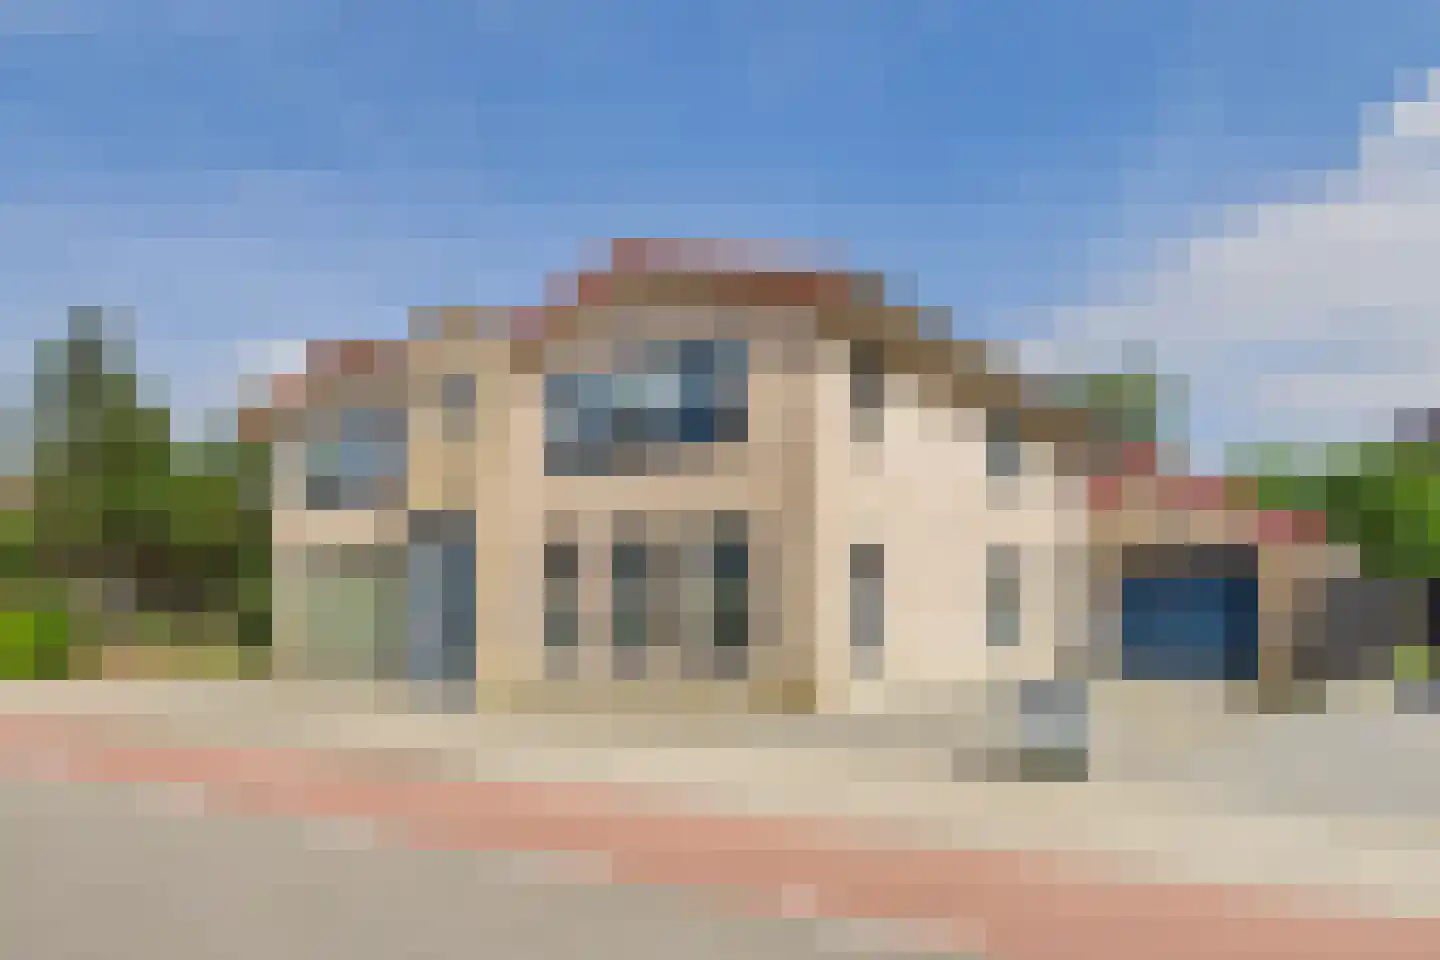
- Available
Julianastraat 70
4566AH Heikant
€ 380.000 k.k.
€ 3.455/m²
- Living area
- 110 m²
- Land area
- 760 m²
- Bedrooms
- 3
Searching in 25 houses in Heikant
Type to search. Use arrow down and arrow up to navigate through results and press Enter to open.
Hidden search suggestions.
View current properties in Heikant or search targeted on street, postal code and property characteristics.
View the current housing stock in Heikant and quickly filter by price, living area, rooms and more. There are currently 25 houses in this place within our selection. View also 12 sold houses in Heikant for extra insight into the local housing market.
4566AH Heikant
€ 380.000 k.k.
€ 3.455/m²
4566AC Heikant
€ 649.500 k.k.
€ 2.706/m²
4566AW Heikant
€ 339.000 k.k.
€ 3.685/m²
4566AH Heikant
€ 699.000 k.k.
€ 3.972/m²
4566AK Heikant
€ 319.000 k.k.
€ 3.097/m²
4566AR Heikant
€ 695.000 k.k.
€ 3.798/m²
4566BP Heikant
€ 669.000 k.k.
€ 3.912/m²
4566BB Heikant
€ 449.500 k.k.
€ 3.746/m²
4566AG Heikant
€ 249.500 k.k.
€ 3.465/m²
4566AP Heikant
€ 349.500 k.k.
€ 2.962/m²
4566BA Heikant
€ 799.000 k.k.
€ 3.073/m²
4566AX Heikant
€ 785.000 k.k.
€ 3.568/m²
4566BZ Heikant
€ 525.000 k.k.
€ 5.412/m²
4566AE Heikant
€ 750.000 k.k.
€ 3.695/m²
4566BC Heikant
€ 410.000 k.k.
€ 3.153/m²
4566AK Heikant
€ 324.500 k.k.
€ 3.687/m²
4566AE Heikant
Price upon request
4566AH Heikant
€ 420.000 k.k.
€ 3.500/m²
4566AH Heikant
€ 619.000 k.k.
€ 3.110/m²
4566AD Heikant
€ 550.000 k.k.
€ 3.846/m²
4566AS Heikant
€ 299.000 k.k.
€ 0/m²
4566AX Heikant
€ 299.000 k.k.
€ 2.794/m²
4566AC Heikant
€ 519.000 k.k.
€ 3.223/m²
4566BB Heikant
€ 425.000 k.k.
€ 3.512/m²
4566BC Heikant
€ 358.000 k.k.
€ 3.314/m²
Get free quotes from real estate agents with local market knowledge. Compare more than 17 real estate agents in Heikant.
Selling a home in Heikant? Compare all real estate agents in Heikant or view the top 10 real estate agents in Heikant for extra context for your choice.
Real estate agents make sharper offers when they know you're comparing — ask for quotes for sale or purchase.
Practical answers about housing supply, sales and comparing real estate agents in Heikant.
The costs of a real estate agent in Heikant depend on commission, setup costs, property presentation and the chosen service. Compare the 17 real estate agents in Heikant via the real estate agent page and request multiple quotes to compare rates and approach well.
Within our selection, we are currently showing 25 houses in Heikant. View also the sold houses in Heikant to compare the current offering with recent transactions.
Take into account not only price and living area but also maintenance, energy label, location, outdoor space and sales status. This way you compare houses in Heikant on more than just the asking price.
A local real estate agent knows the neighborhoods, recent transactions and demand in Heikant. By comparing 17 real estate agents in the region you get a better insight into prices, sales strategy and expected yield; the top 10 in Heikant provides a useful starting point.
Yes, when making a sales plan, a valuation in Heikant is wise. You gain insight into a realistic asking price and can then compare offers from real estate agents specifically.
View current location data on residents, WOZ development, housing stock, energy consumption, business activity and safety in Heikant. In 2025 were there 1.205 residents. The average WOZ value in 2025 is EUR 398.000.
These figures help to better assess and compare the housing stock in Heikant with recent sold homes. Orient yourself then on suitable top real estate agents in Heikant for sales advice in this region.
Residents
1.205
Last year: 2025
Average WOZ
EUR 398.000
Last year: 2025
Average income per person.
EUR 34.700
Source: AllNumbers
Crimes (current year)
19
Total registered
| Year | Residents |
|---|---|
| 2021 | 1.120 |
| 2022 | 1.155 |
| 2023 | 1.160 |
| 2024 | 1.165 |
| 2025 | 1.205 |
| Year | Average WOZ |
|---|---|
| 2021 | EUR 299.000 |
| 2022 | EUR 323.000 |
| 2023 | EUR 362.000 |
| 2024 | EUR 384.000 |
| 2025 | EUR 398.000 |
Hoger
230
Praktisch
120
Middelbaar
570
Europa
430
Nederland
720
Buiten Europa
55
Label G
132
Label B
112
Label C
94
Label A
71
Label D
41
Label F
39
Label A+++
16
Label E
13
Label A+
7
Label A++
7
Label A++++
1
Label A+++++
0
| Year | Gas (m3) | Electricity (kWh) |
|---|---|---|
| 2020 | 1.550 | 3.160 |
| 2021 | 1.730 | 3.430 |
| 2022 | 1.380 | 3.380 |
| 2023 | 1.140 | 3.200 |
| 2024 | 1.070 | 3.370 |
Hoekwoning
Gas: 890 • Electricity: 1.660
Huurwoning
Gas: 980 • Electricity: 1.780
Koopwoning
Gas: 1.160 • Electricity: 3.400
Tussenwoning
Gas: 760 • Electricity: 1.540
Vrijstaande woning
Gas: 1.200 • Electricity: 3.560
Twee-onder-één-kap woning
Gas: 1.030 • Electricity: 2.260
Total number of company establishments: 155
| Period | Crimes |
|---|---|
| jan 2026 | 2 |
| jul 2025 | 5 |
| jun 2025 | 2 |
| mei 2025 | 0 |
| mrt 2025 | 0 |
| mrt 2026 | 0 |
| nov 2024 | 0 |
| nov 2025 | 1 |
| okt 2024 | 3 |
| okt 2025 | 0 |
| sep 2024 | 3 |
| sep 2025 | 4 |
These figures give an indicative picture of safety trends in the living environment of Heikant.
Short answers based on current local statistics, handy for a quick comparison of the living environment.
Heikant telt in 2025 ongeveer 1.205 inwoners.
De gemiddelde WOZ-waarde in Heikant is in 2025 circa € 398.000.
Het gemiddelde inkomen per inwoner in Heikant ligt rond € 34.700 per jaar.
Voor het huidige jaar gaat het om ongeveer 19 geregistreerde misdrijven. Gebruik deze cijfers als indicatie en vergelijk trends per periode.
In Heikant komt vooral "Vrijstaande woningen" veel voor, met ongeveer 434 woningen.