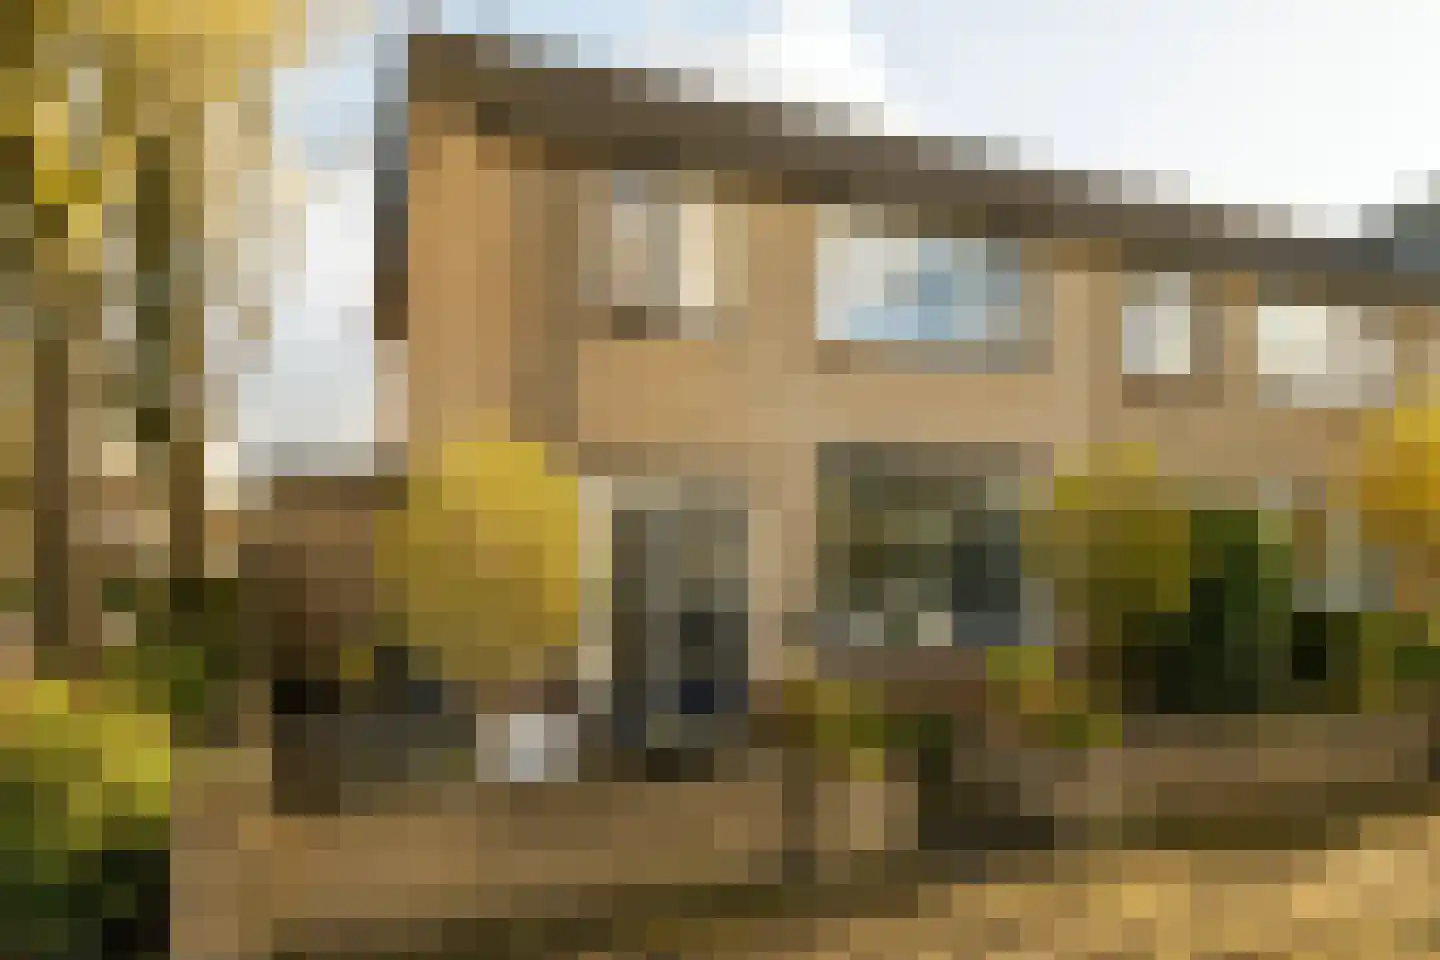
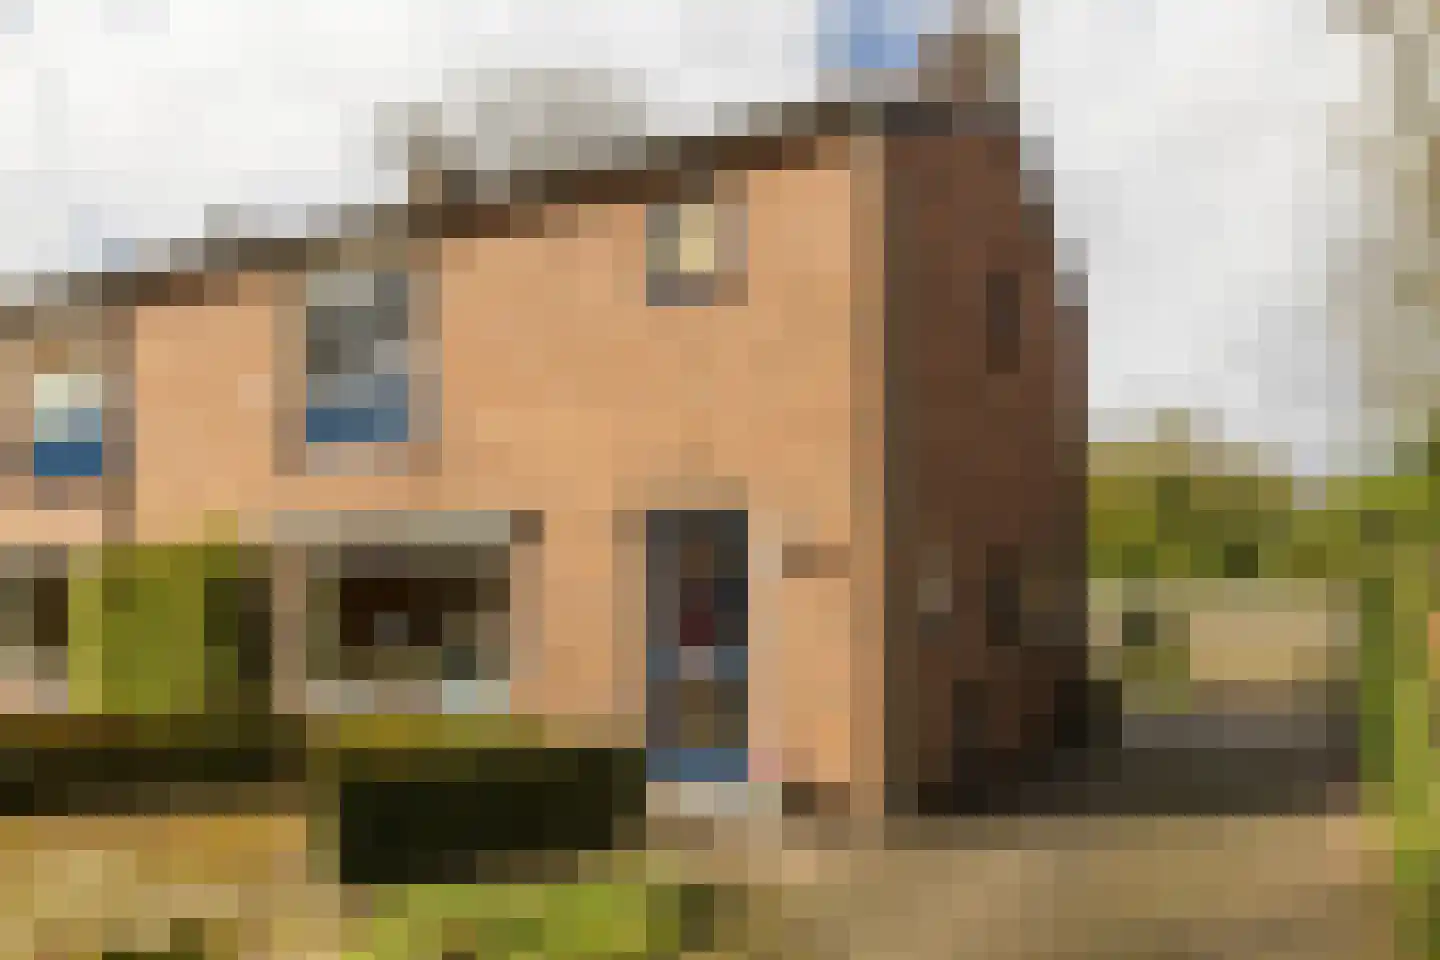
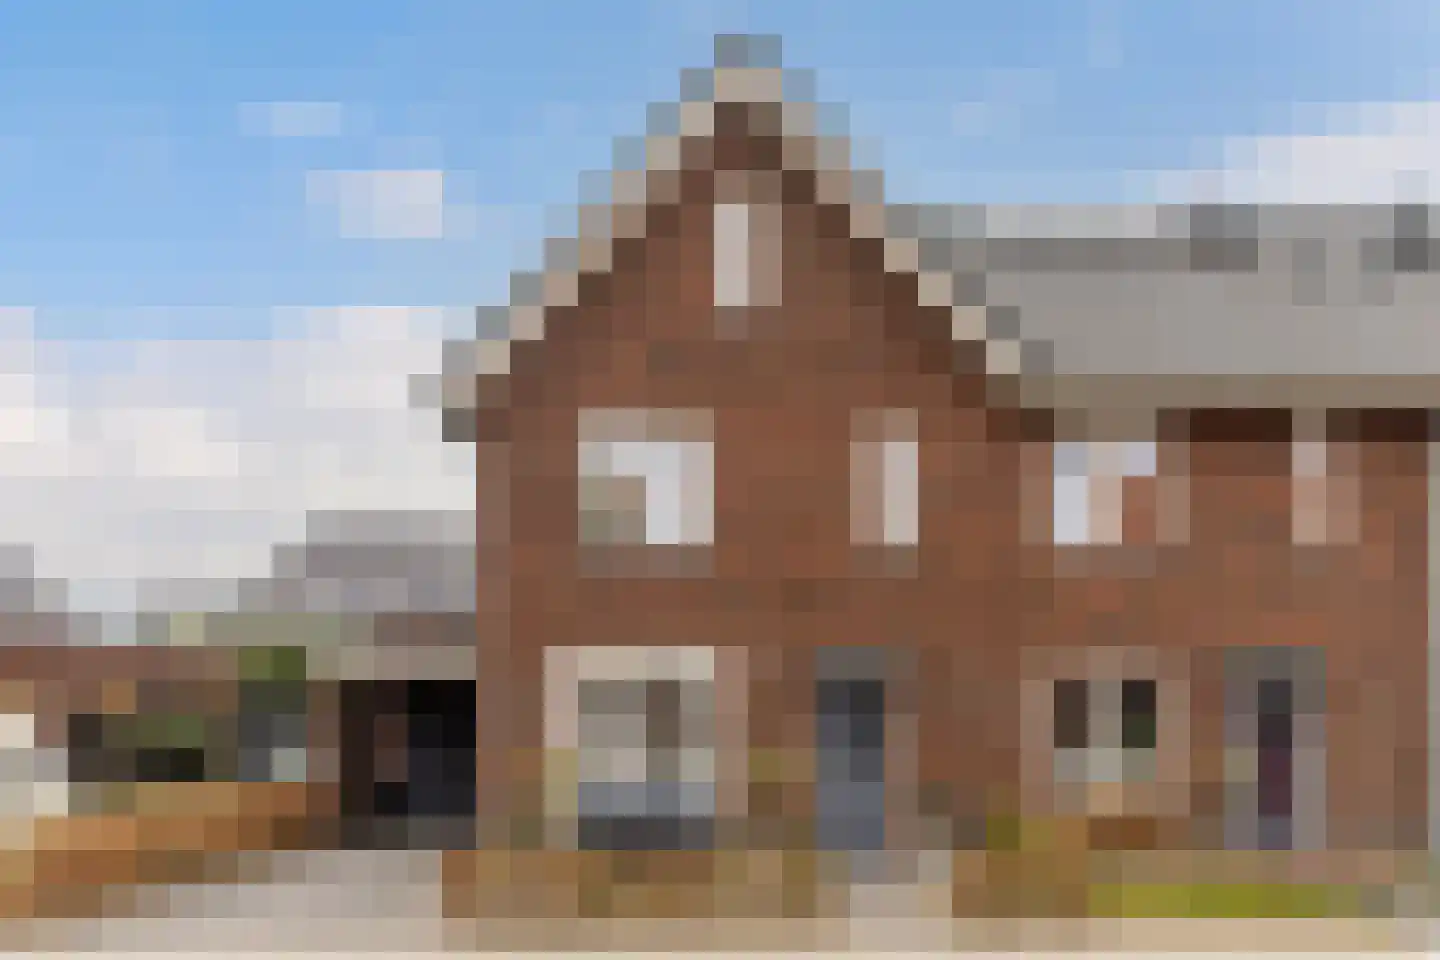
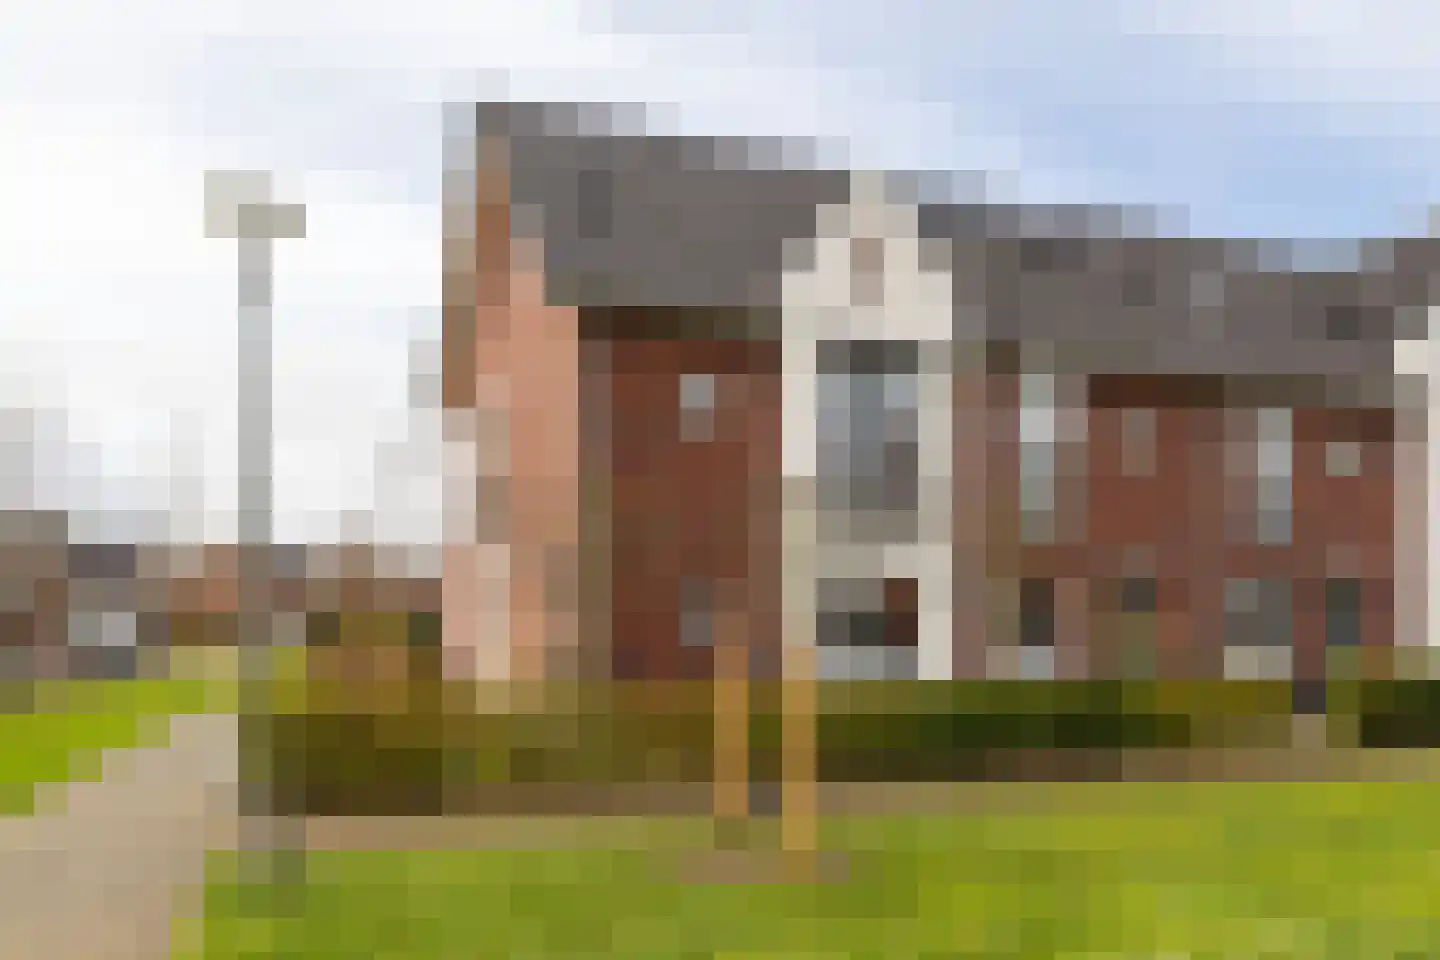
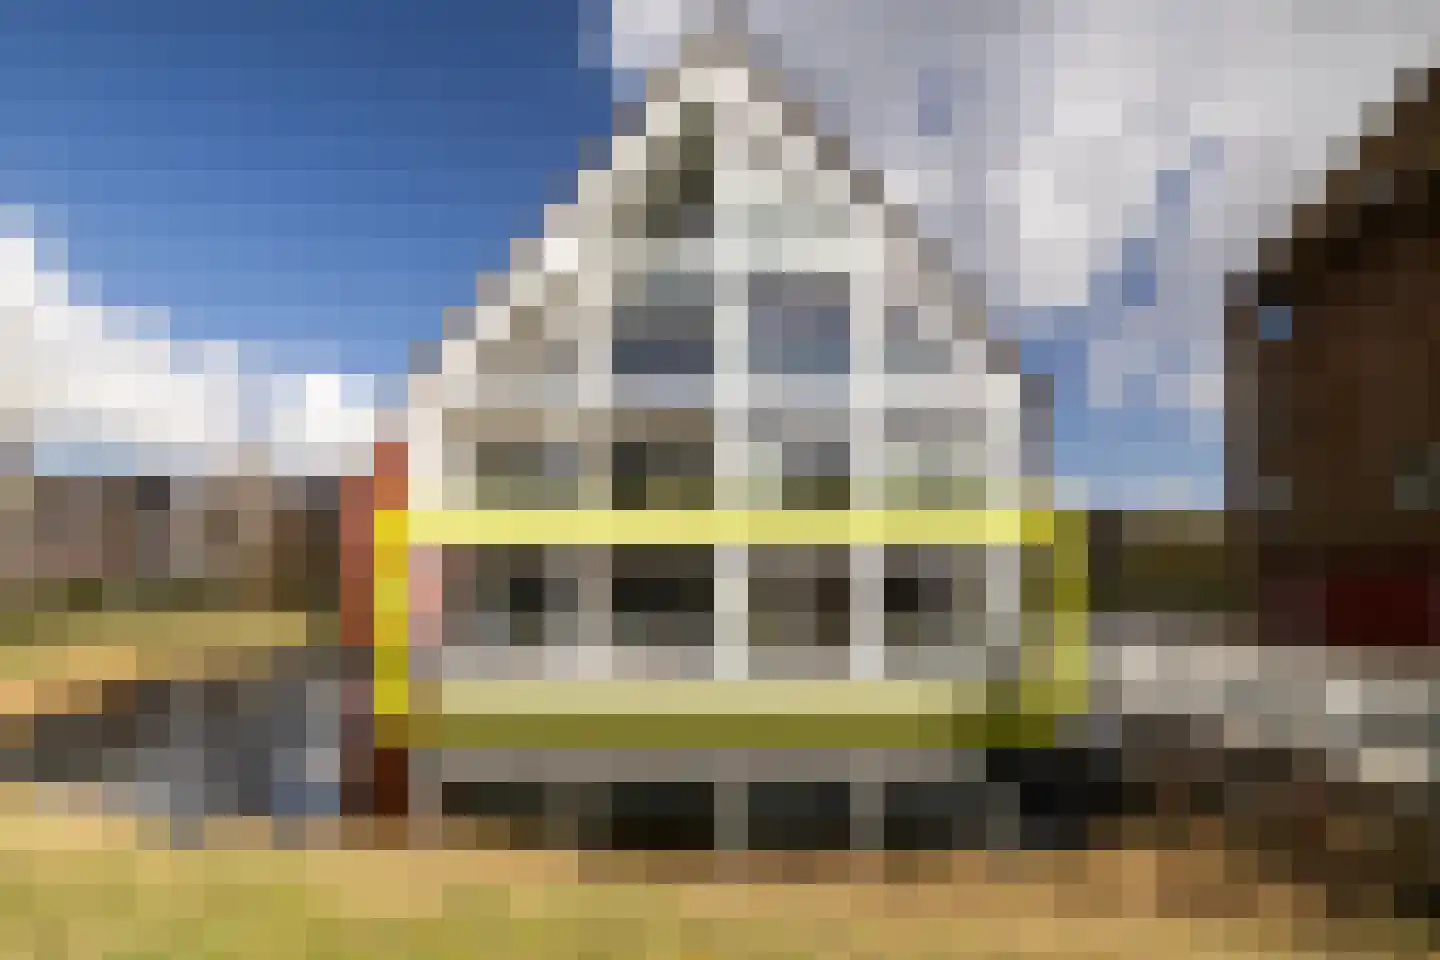
- Sold
Hamermolen 1
8071MT Nunspeet
€ 779.000 k.k.
€ 4.693/m²
- Living area
- 166 m²
- Land area
- 295 m²
- Bedrooms
- 4
Searching in 258 houses in Nunspeet
Type to search. Use arrow down and arrow up to navigate through results and press Enter to open.
Hidden search suggestions.
View current properties in Nunspeet or search targeted on street, postal code and property characteristics.
View the current housing stock in Nunspeet and quickly filter by price, living area, rooms and more. There are currently 258 houses in this place within our selection. View also 181 sold houses in Nunspeet for extra insight into the local housing market.
8071MT Nunspeet
€ 779.000 k.k.
€ 4.693/m²
8072DS Nunspeet
€ 475.000 k.k.
€ 4.060/m²
8071ED Nunspeet
€ 419.000 k.k.
€ 5.238/m²
8071TD Nunspeet
€ 699.000 k.k.
€ 4.539/m²
8071MX Nunspeet
€ 649.000 k.k.
€ 4.772/m²
8071GT Nunspeet
€ 649.000 k.k.
€ 4.538/m²
8071TV Nunspeet
€ 689.000 k.k.
€ 5.066/m²
8071VS Nunspeet
€ 549.000 k.k.
€ 5.330/m²
8072PK Nunspeet
€ 109.000 k.k.
€ 2.018/m²
8071EN Nunspeet
€ 895.000 k.k.
€ 3.163/m²
8071DN Nunspeet
€ 315.000 k.k.
€ 6.057/m²
8071ZA Nunspeet
€ 474.500 k.k.
€ 3.438/m²
8071XM Nunspeet
€ 429.500 k.k.
€ 3.671/m²
8072ZG Nunspeet
€ 499.000 k.k.
€ 3.514/m²
8071WG Nunspeet
€ 575.000 k.k.
€ 5.324/m²
8071BK Nunspeet
€ 699.000 k.k.
€ 4.368/m²
8071XR Nunspeet
€ 359.000 k.k.
€ 4.080/m²
8071KN Nunspeet
€ 459.000 k.k.
€ 4.135/m²
8071WV Nunspeet
Price upon request
8071WT Nunspeet
€ 798.000 k.k.
€ 5.148/m²
8071DV Nunspeet
€ 679.000 k.k.
€ 3.925/m²
8072BV Nunspeet
€ 319.000 k.k.
€ 5.230/m²
8071WD Nunspeet
€ 795.000 k.k.
€ 4.622/m²
8072JV Nunspeet
€ 389.000 k.k.
€ 3.569/m²
8071CA Nunspeet
€ 399.000 k.k.
€ 5.050/m²
8071HL Nunspeet
€ 499.000 k.k.
€ 4.264/m²
8072CT Nunspeet
€ 1.095.000 k.k.
€ 5.530/m²
8071BN Nunspeet
€ 595.000 k.k.
€ 5.458/m²
Get free quotes from real estate agents with local market knowledge. Compare more than 23 real estate agents in Nunspeet.
Selling a home in Nunspeet? View the sales-oriented guide sell a house in Nunspeet, compare all real estate agents in Nunspeet or view the top 10 real estate agents in Nunspeet for extra context to your choice.
Real estate agents make sharper offers when they know you're comparing — ask for quotes for sale or purchase.
Practical answers about housing supply, sales and comparing real estate agents in Nunspeet.
The costs of a real estate agent in Nunspeet depend on commission, setup costs, property presentation and the chosen service. Compare the 23 real estate agents in Nunspeet via the real estate agent page and request multiple quotes to compare rates and approach well.
Within our selection, we are currently showing 258 houses in Nunspeet. View also the sold houses in Nunspeet to compare the current offering with recent transactions.
Take into account not only price and living area but also maintenance, energy label, location, outdoor space and sales status. This way you compare houses in Nunspeet on more than just the asking price.
A local real estate agent knows the neighborhoods, recent transactions and demand in Nunspeet. By comparing 23 real estate agents in the region you get a better insight into prices, sales strategy and expected yield; the top 10 in Nunspeet provides a useful starting point.
Yes, when making a sales plan, a valuation in Nunspeet is wise. You gain insight into a realistic asking price and can then compare offers from real estate agents specifically.
View current location data on residents, WOZ development, housing stock, energy consumption, business activity and safety in Nunspeet. In 2026 were there 21.692 residents. The average WOZ value in 2025 is EUR 421.313.
These figures help to better assess and compare the housing stock in Nunspeet with recent sold homes. Orient yourself then on suitable top real estate agents in Nunspeet for sales advice in this region.
Residents
21.692
Last year: 2026
Average WOZ
EUR 421.313
Last year: 2025
Average income per person.
EUR 30.460
Source: AllNumbers
Crimes (current year)
725
Total registered
| Year | Residents |
|---|---|
| 2021 | 20.520 |
| 2022 | 20.640 |
| 2023 | 21.030 |
| 2024 | 21.235 |
| 2025 | 21.505 |
| 2026 | 21.692 |
| Year | Average WOZ |
|---|---|
| 2021 | EUR 296.910 |
| 2022 | EUR 328.274 |
| 2023 | EUR 371.395 |
| 2024 | EUR 398.051 |
| 2025 | EUR 421.313 |
Hoger
3.620
Praktisch
4.720
Middelbaar
6.810
Europa
790
Nederland
19.200
Buiten Europa
1.525
Label C
2.720
Label A
2.625
Label B
1.428
Label D
757
Label G
478
Label F
427
Label E
364
Label A+++
300
Label A++
252
Label A+
138
Label A++++
23
Label A+++++
6
| Year | Gas (m3) | Electricity (kWh) |
|---|---|---|
| 2020 | 1.275 | 2.928 |
| 2021 | 1.417 | 2.978 |
| 2022 | 1.122 | 2.809 |
| 2023 | 925 | 2.659 |
| 2024 | 896 | 2.751 |
Hoekwoning
Gas: 877 • Electricity: 2.680
Huurwoning
Gas: 742 • Electricity: 2.036
Koopwoning
Gas: 1.045 • Electricity: 3.028
Appartement
Gas: 662 • Electricity: 1.867
Tussenwoning
Gas: 787 • Electricity: 2.349
Vrijstaande woning
Gas: 1.394 • Electricity: 3.623
Twee-onder-één-kap woning
Gas: 1.069 • Electricity: 3.069
Total number of company establishments: 2.730
| Period | Crimes |
|---|---|
| jan 2026 | 45 |
| jul 2025 | 69 |
| jun 2025 | 70 |
| mei 2025 | 39 |
| mrt 2025 | 73 |
| mrt 2026 | 72 |
| nov 2024 | 63 |
| nov 2025 | 70 |
| okt 2024 | 49 |
| okt 2025 | 64 |
| sep 2024 | 60 |
| sep 2025 | 70 |
These figures give an indicative picture of safety trends in the living environment of Nunspeet.
Short answers based on current local statistics, handy for a quick comparison of the living environment.
Nunspeet telt in 2026 ongeveer 21.692 inwoners.
De gemiddelde WOZ-waarde in Nunspeet is in 2025 circa € 421.313.
Het gemiddelde inkomen per inwoner in Nunspeet ligt rond € 30.460 per jaar.
Voor het huidige jaar gaat het om ongeveer 725 geregistreerde misdrijven. Gebruik deze cijfers als indicatie en vergelijk trends per periode.
In Nunspeet komt vooral "Tussenwoningen" veel voor, met ongeveer 2.729 woningen.